-
Machine Learning with Python - Regression(Simple, Multiple, Non-linear regression)Data Science 2022. 8. 19. 11:03
- Regression: a process of predicting a continuous value
- Types of regression models: Simple Regression / Multiple Regression
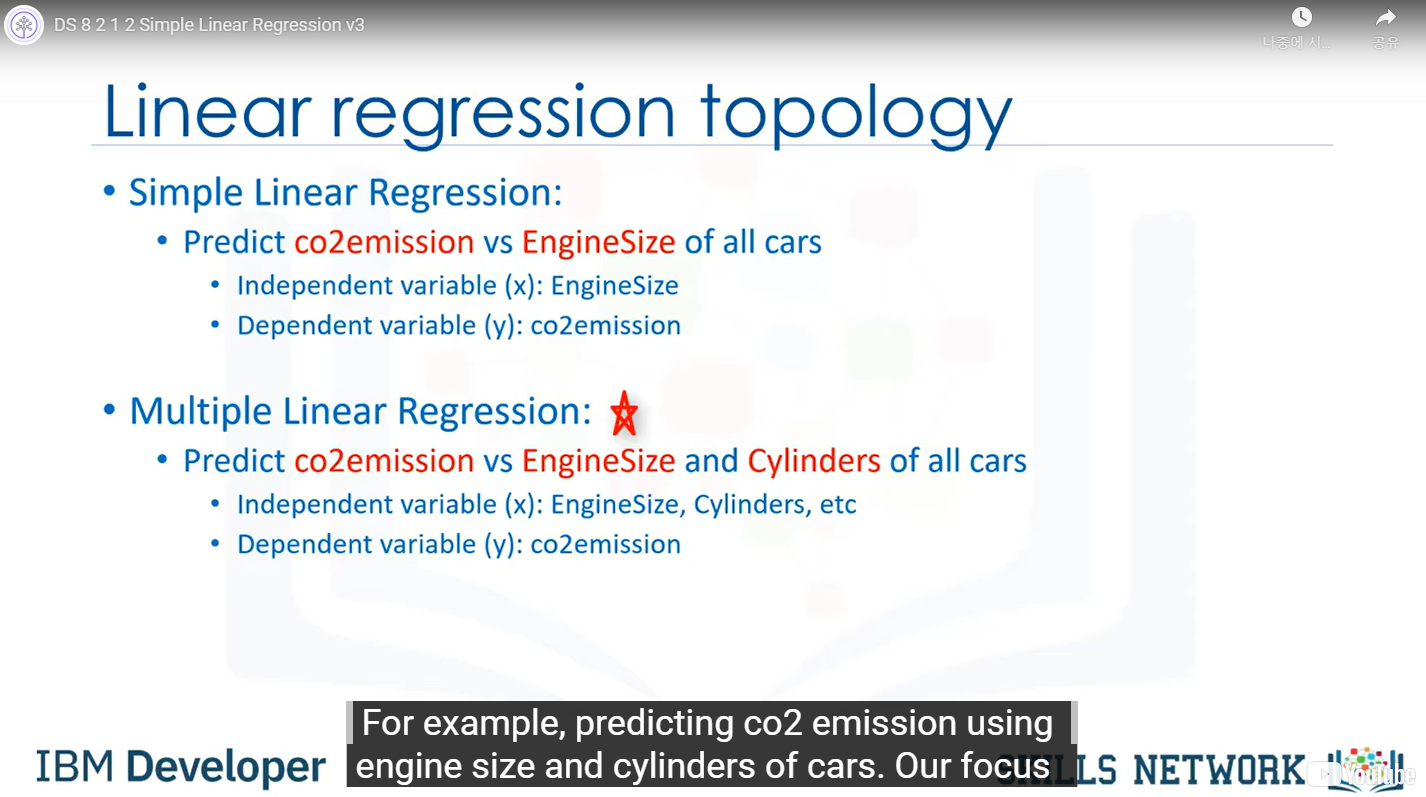
- Simple Linear Regression: one independent variable(x)을 갖고 하나의 dependent variable(y)을 도출해 내는 것
- Multiple Linear Regression: 여러개의 Independent variable 을 갖고 하나의 dependent variable 을 도출해 내는 것
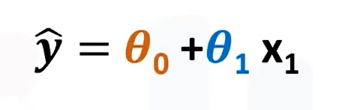
- Simple Linear Regression 공식. 세타1은 coefficient 라고 불리고, 쎄타0는 Intercept라고 불린다
- How to find the best fit for Simple Linear Regression? There are two ways
- 1. Mathematical Research / 2. Optimization approach
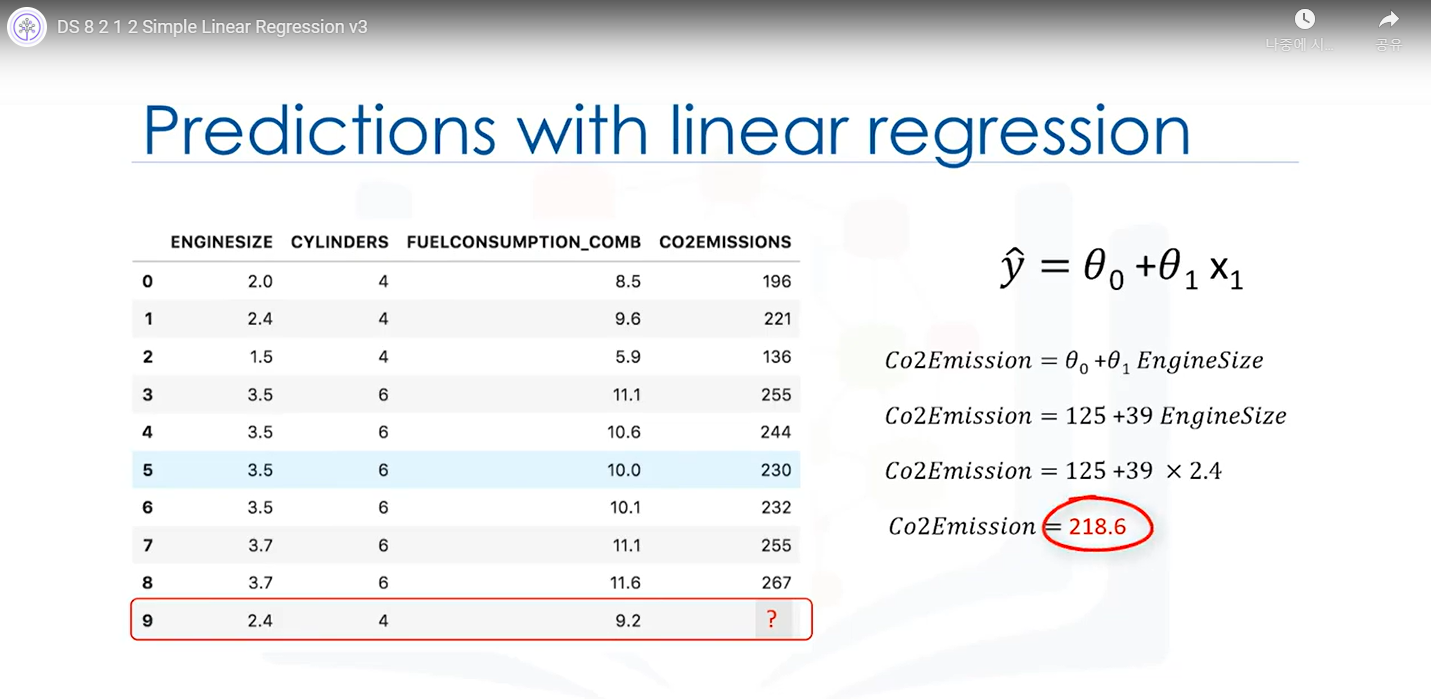
Co2Emission 구하는 과정: 먼저 쎄타0와 쎄타1의 값을 구한다. -> EngineSize 대입(x) -> Co2Emission(Yhat)출력
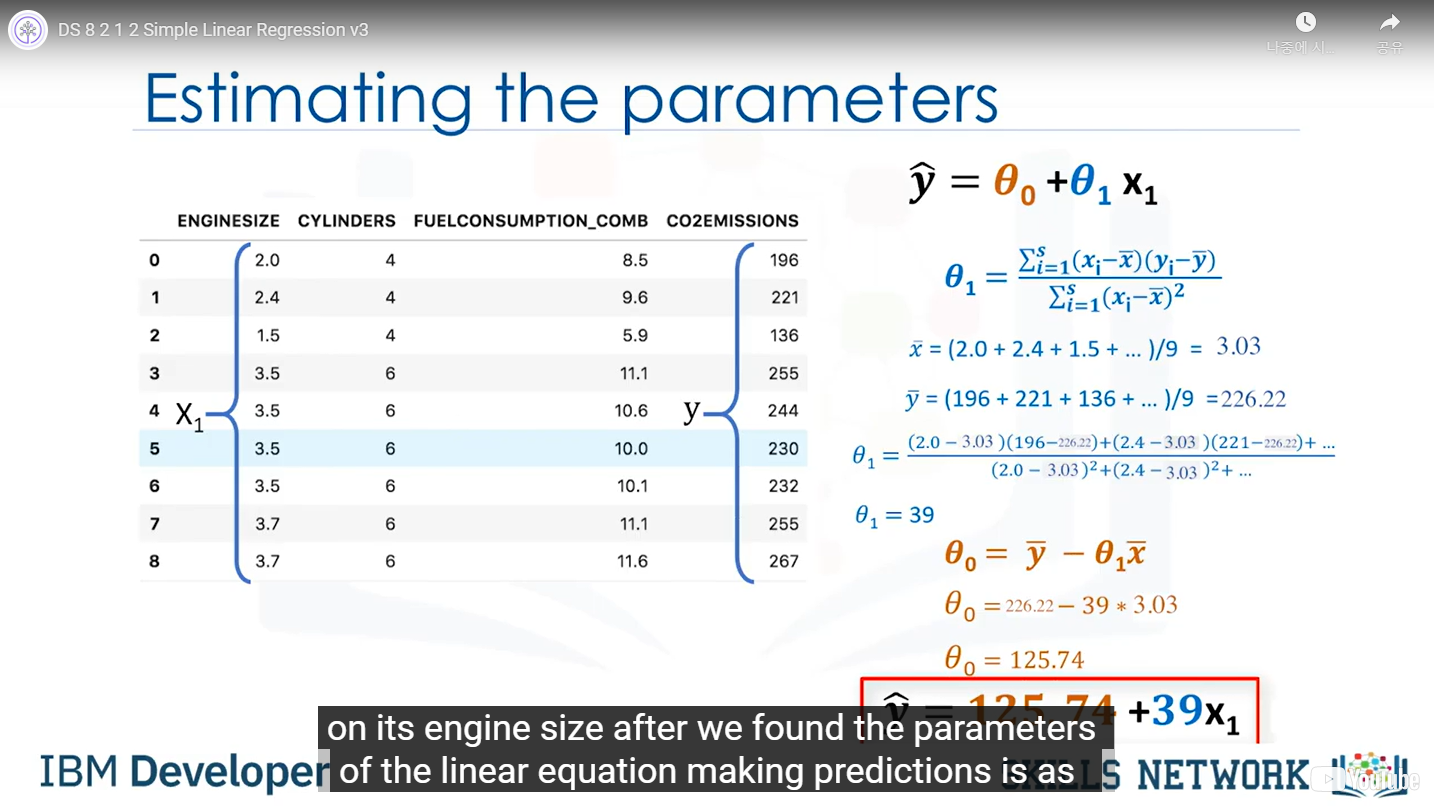
- 쎄타0와 쎄타1을 구하는 과정: 핵심은 x값과 y값의 평균값 산출에 있음
- Model Evaluation Process: Segments consist mainly of two parts which are 1. Train and Test on the Same Dataset 2. Train/Test split
- Train and Test on the Same Dataset: The process to obtain not only high training accuracy but also high out-of-sample accuracy
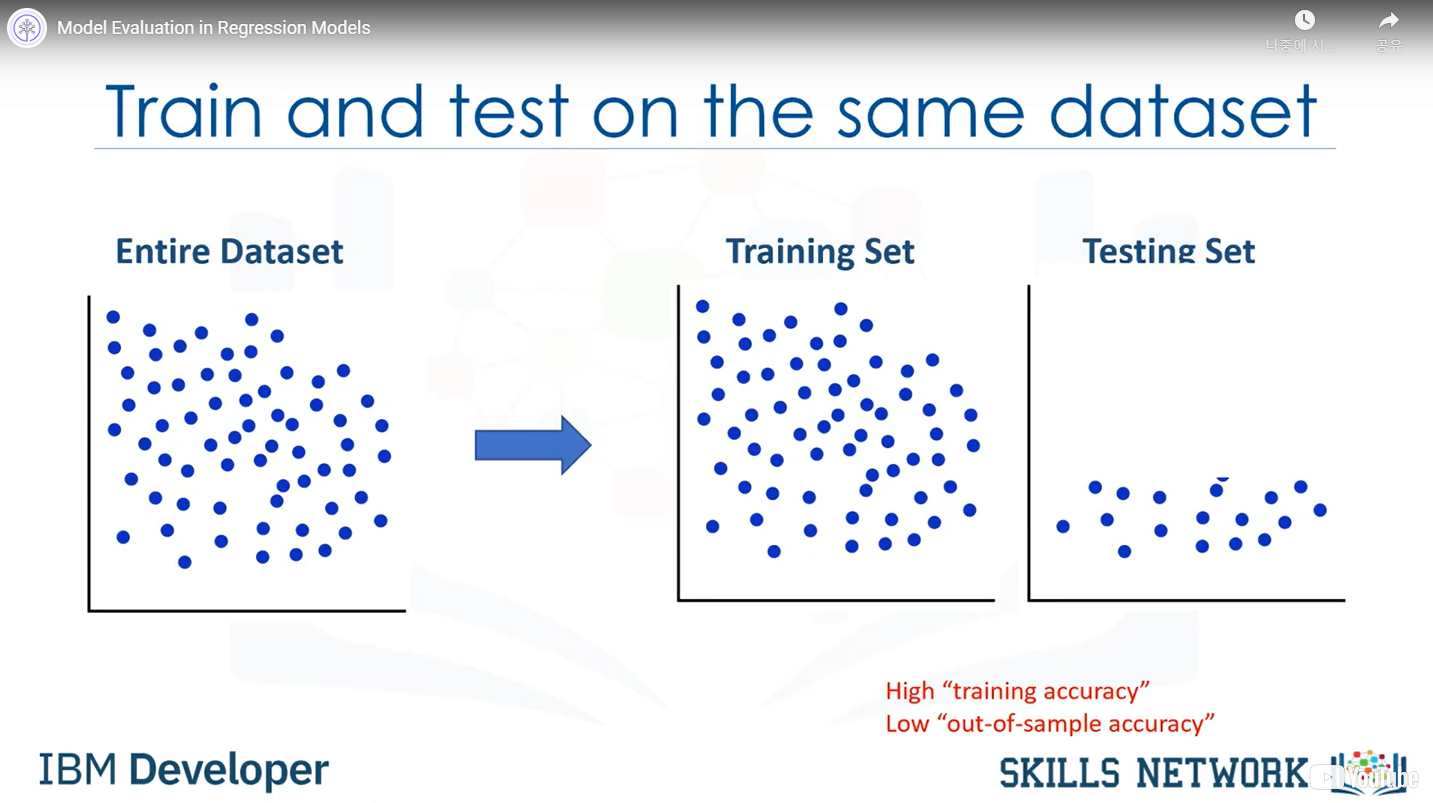
- Why do we need training & out-of-sample accuracy?
To prevent over-fitting
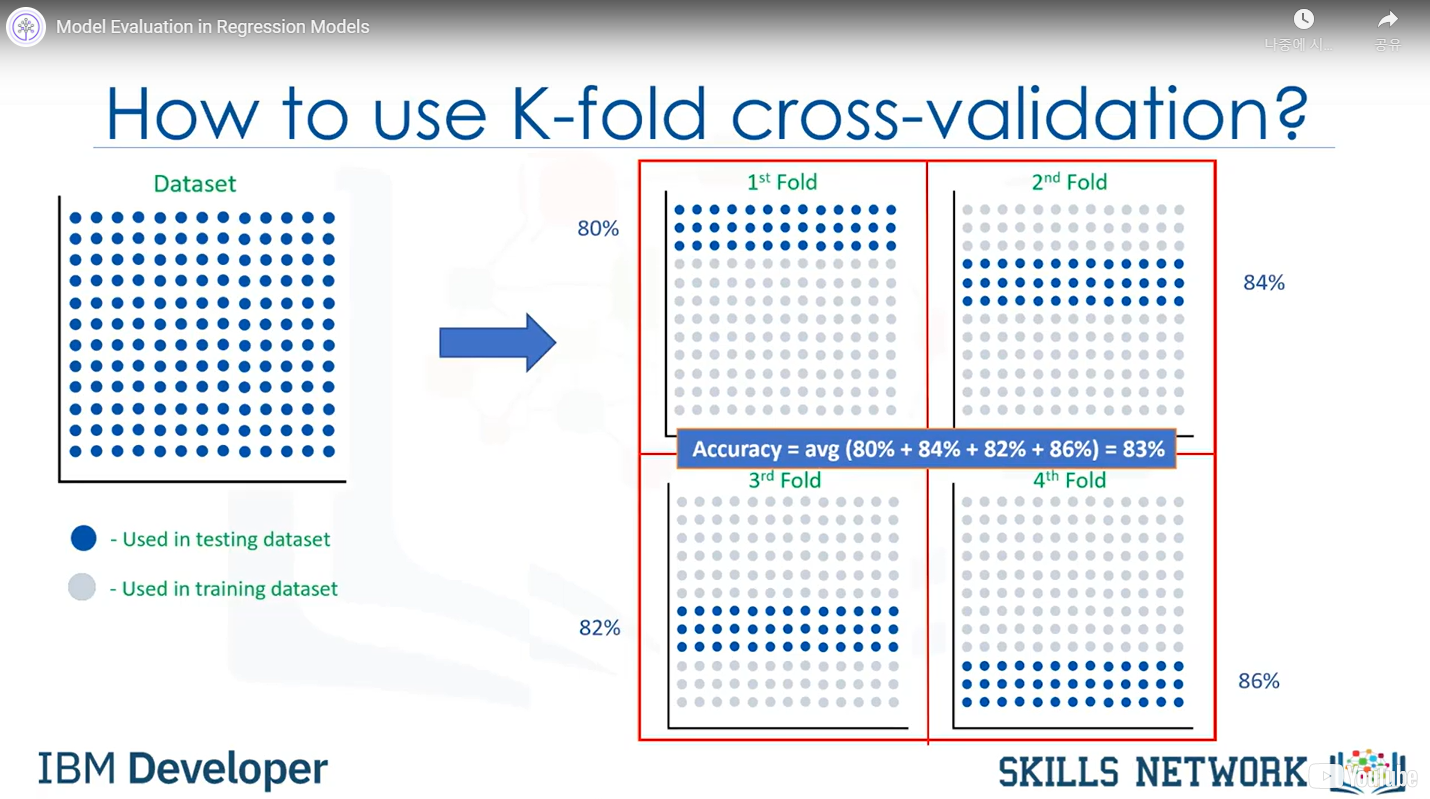
- How do we prevent over-fitting and increase the accuracy of unknown data?
We use cross-validation
- Cross-validation: 데이터를 여러 Training set 과 Testing set 으로 나누어서 여러 번에 걸쳐서 검증하는 것
-
- Evaluation metrics: model의 성능을 표현하기 위해 사용됨
- Regression accuracy 는 MAE(mean absolute error), MSE(mean squared error), RMSE(root mean squared error)등으로 인해 정해진다
- What is the error?
The difference between Actual value and Predicted value. 에러는 어떤 type의 모델을 선정하는지에 따라서 달라진다.

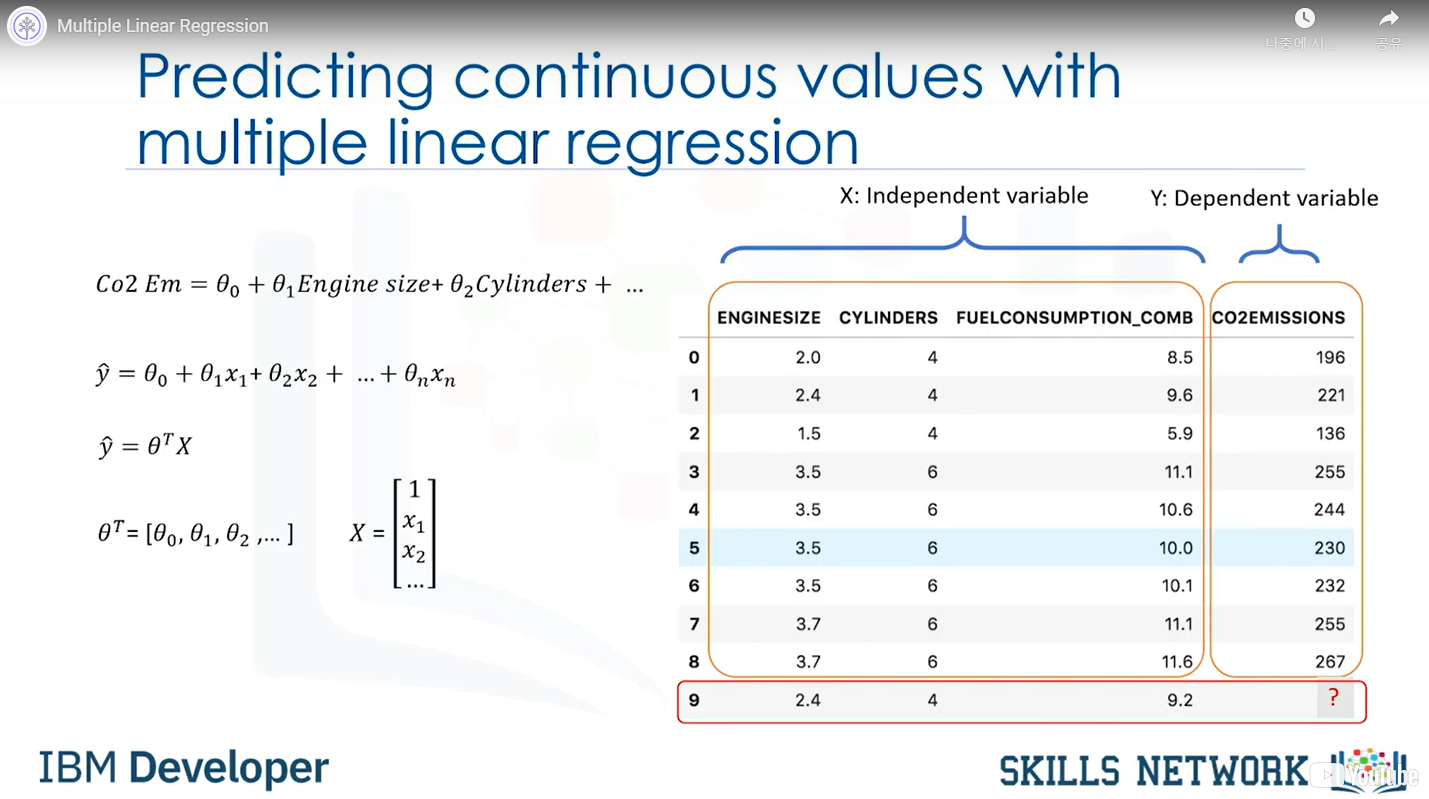
- Multiple Linear Regression
For example, it's to predict Co2emission vs EngineSize and Cylinders of all cars. 쉽게 말해 독립변수 여럿과 종속변수 하나와의 관계를 밝혀내는 모델
- Multiple Linear Regression 에서의 쎄타: 독립변수가 많아질수록 각각 독립변수를 할당하는 쎄타값을 가진다
- How to estimate Theta in multiple linear regression?
- Ordinary Least Squares: Takes a long time for large datasets(10K + rows)
- Optimization algorism
Gradient Descent 을 사용한다. Gradient Descent 란? MSE를 미분하여 그라디언트가 영벡터가 되는 지점을 찾는 과정. 즉, MSE가 최소값을 갖는 모델을 구하는 과정.

- 이런식으로 계속 내려온다 - - Multiple Linear Regression model 을 쓸 때의 주의점: 1. Don’t' add too many independent variables 2. Use dummy for categorical variables 3. Every independent variables should show the linear relationship with dependent variables
- Polynomial Regression: When the independent and dependent variants are not linearly related, polynomial regression is used to show the relationship. For example, China's GDP growth
-

- Polynomial Regression에는 linear regression, quadratic regression, cubic regression 전부를 포함함. X(독립변수)의 차수가 n차로 되어있는 모델을 전부 polynomial regression이라고 부름
- How can I know if a problem is linear or non-linear in an easy way?
- Inspect Visually: Plotting -> Calculate the correlation. Then,
- Based on accuracy: Calculate the error
- How should I model my data, if it displays non-linear on a scatter plot?
Polynomial regression / Non-linear regression model / Transform your data
'Data Science' 카테고리의 다른 글
Machine Learning with Python - Clustering (0) 2022.10.07 Machine Learning with Python - Classification(작성중) (0) 2022.08.20 Machine Learning with Python - Intro (0) 2022.08.18 goodFeaturesToTrack method 이용해 코너 검출시 Can't parse 'center'. Sequence item with index 0 has a wrong type 에러 (0) 2022.08.14 Data Analysis with Python - Module Evaluation & Learning Objectvies (0) 2022.08.13