-
Machine Learning with Python - Classification(작성중)Data Science 2022. 8. 20. 23:01
- What is classification?
A supervised approach, categorizing some unknown items into a discrete set of categories of classes
- Normally, unlabeled test case 에는 defualt 값을 지정해 0또는 1로 표시한다. -> binary classifier
Category가 여럿인 multi-class classification 도 있다

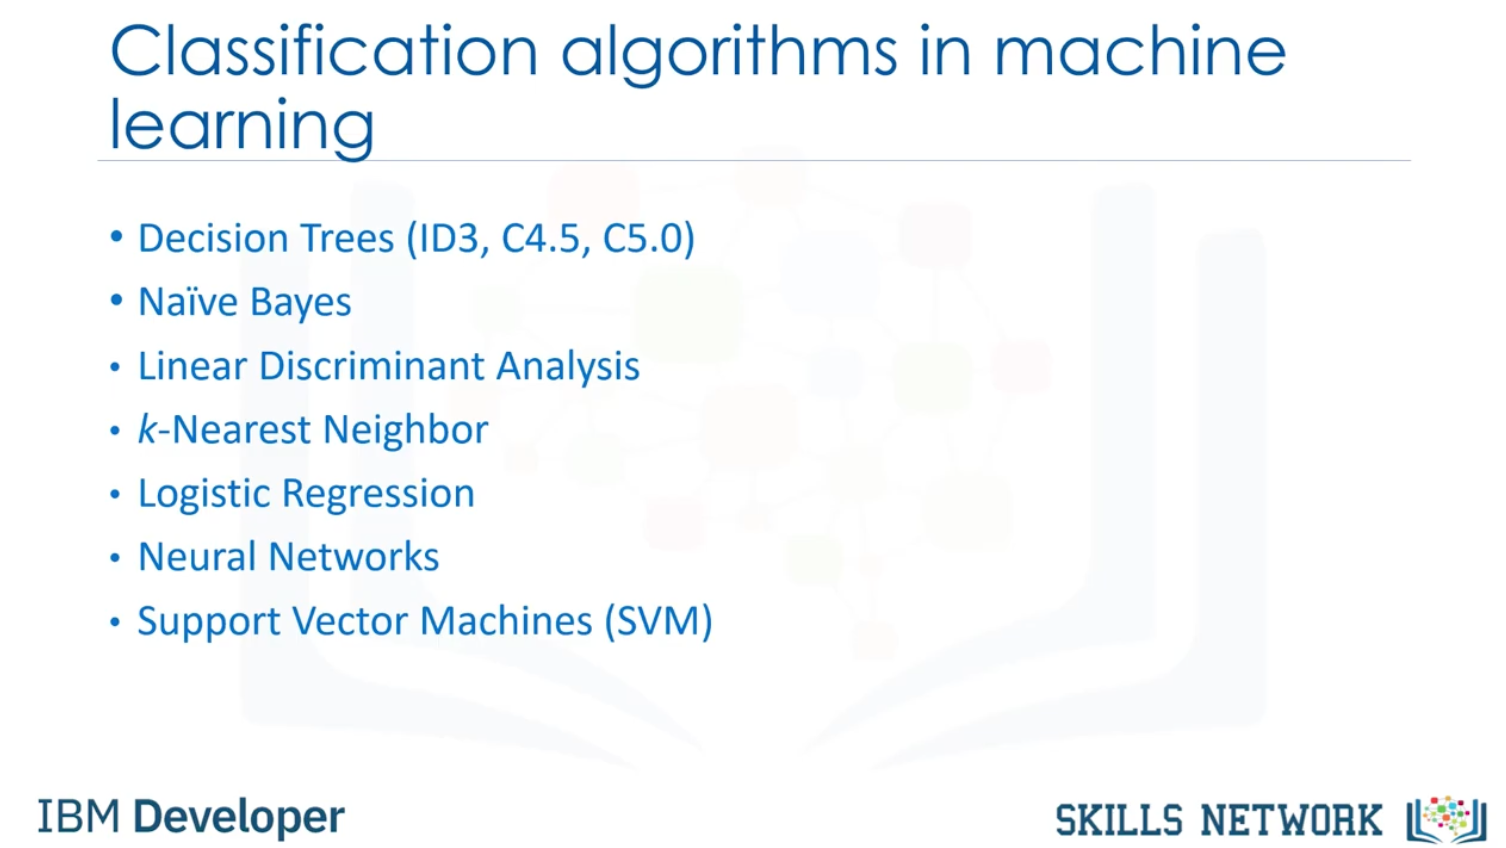
Multi-Class classification의 예 - Classification 의 종류
- K-Nearest Neighbor classification(KNN algorithm) 이란?
인접한 변수끼리 묶어 주는 것

- K-nearest neighbors algorism process
1. Pick a value for K
2. Calculate the distance of an unknown case from all cases
3. Search for the K-observations in the training data that are 'Nearest' to the unknown data point
4. Predict the response of the unknown data point using the most popular response value from the k-nearest neighbors
- So there are two confusing parts in this algorism: 1. How to select the correct K? 2. How to compute the similarity between cases, for instance among customers?
- How to calculate similarity? Euclidean distance 사용

Euclidean distance 사용의 예 
Multi-dimensional vector에도 적용가능. 물론 데이터가 normalized 된 상태여야 한다 - How to find the best value of K?
If we choose low value of K -> overfitting 발생
if we choose high value of K -> overly generalized
Best K 를 찾는 방법은, 먼저 training set을 K=1로 맞춰 모델을 피팅하고, testing set을 이용해 accuracy를 계산한다. K를 조금씩 올려가면서 어떤 K값이 가장 나은지 찾는다.
- Evaluation Metrics 의 종류
Jaccard index, F1-score, Log loss
- Jaccard index란?

Actual label과 Predicted label을 비교, 수식은 위와 같다 - F1-score 방법
Confusion matrix을 이용해서 Actual value와 predicted value 를 비교, 이것을 바탕으로 precision과 recall을 계산하고, F1-score를 구할 수 있다
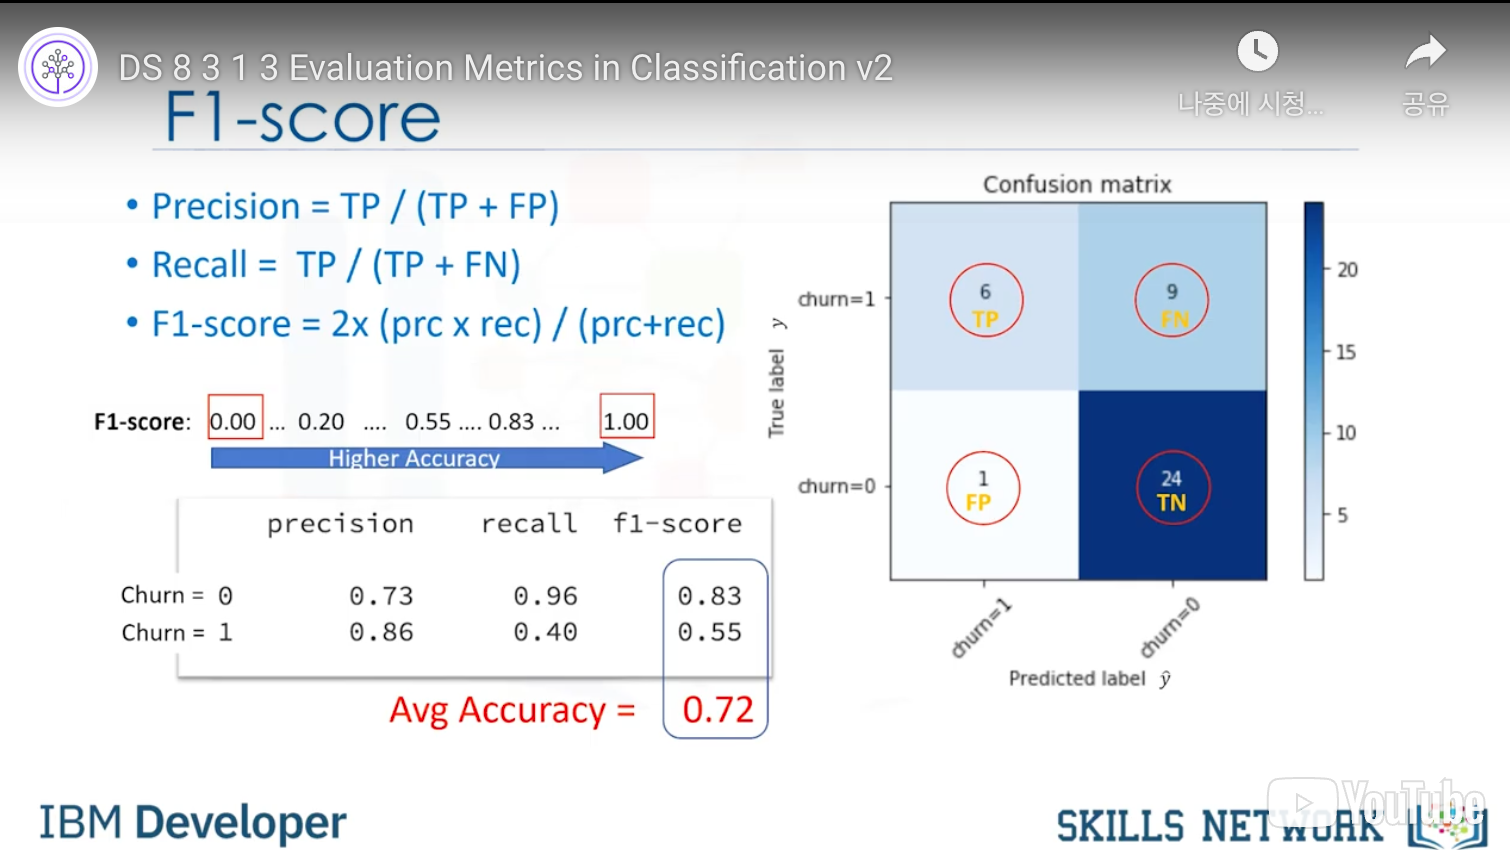
F1-score가 1.00이 될때 highest accuracy를 갖게 된다 - Log loss 방법
마찬가지로 predicted value가 0에서 1까지의 값을 가진다. Actual Value 와 Predicted Value 값을 비교하여, 가장 logloss가 작은 classifier을 찾는 것

- What is a decision tree?
환자가 어떤 약을 처방받을지 age, sex, cholesterol level 등에 따라 분류해 처방하는 것

internal node, branch, leaf node 로 이루어짐 - How can we build the decision tree?
1. Choose an attribute from your dataset
2. Calculate the significance of attribute in splitting of data
3. Split data based on the value of the best attribute
4. Go to 1
- Which attribute is the best? / How do we select the attribute?
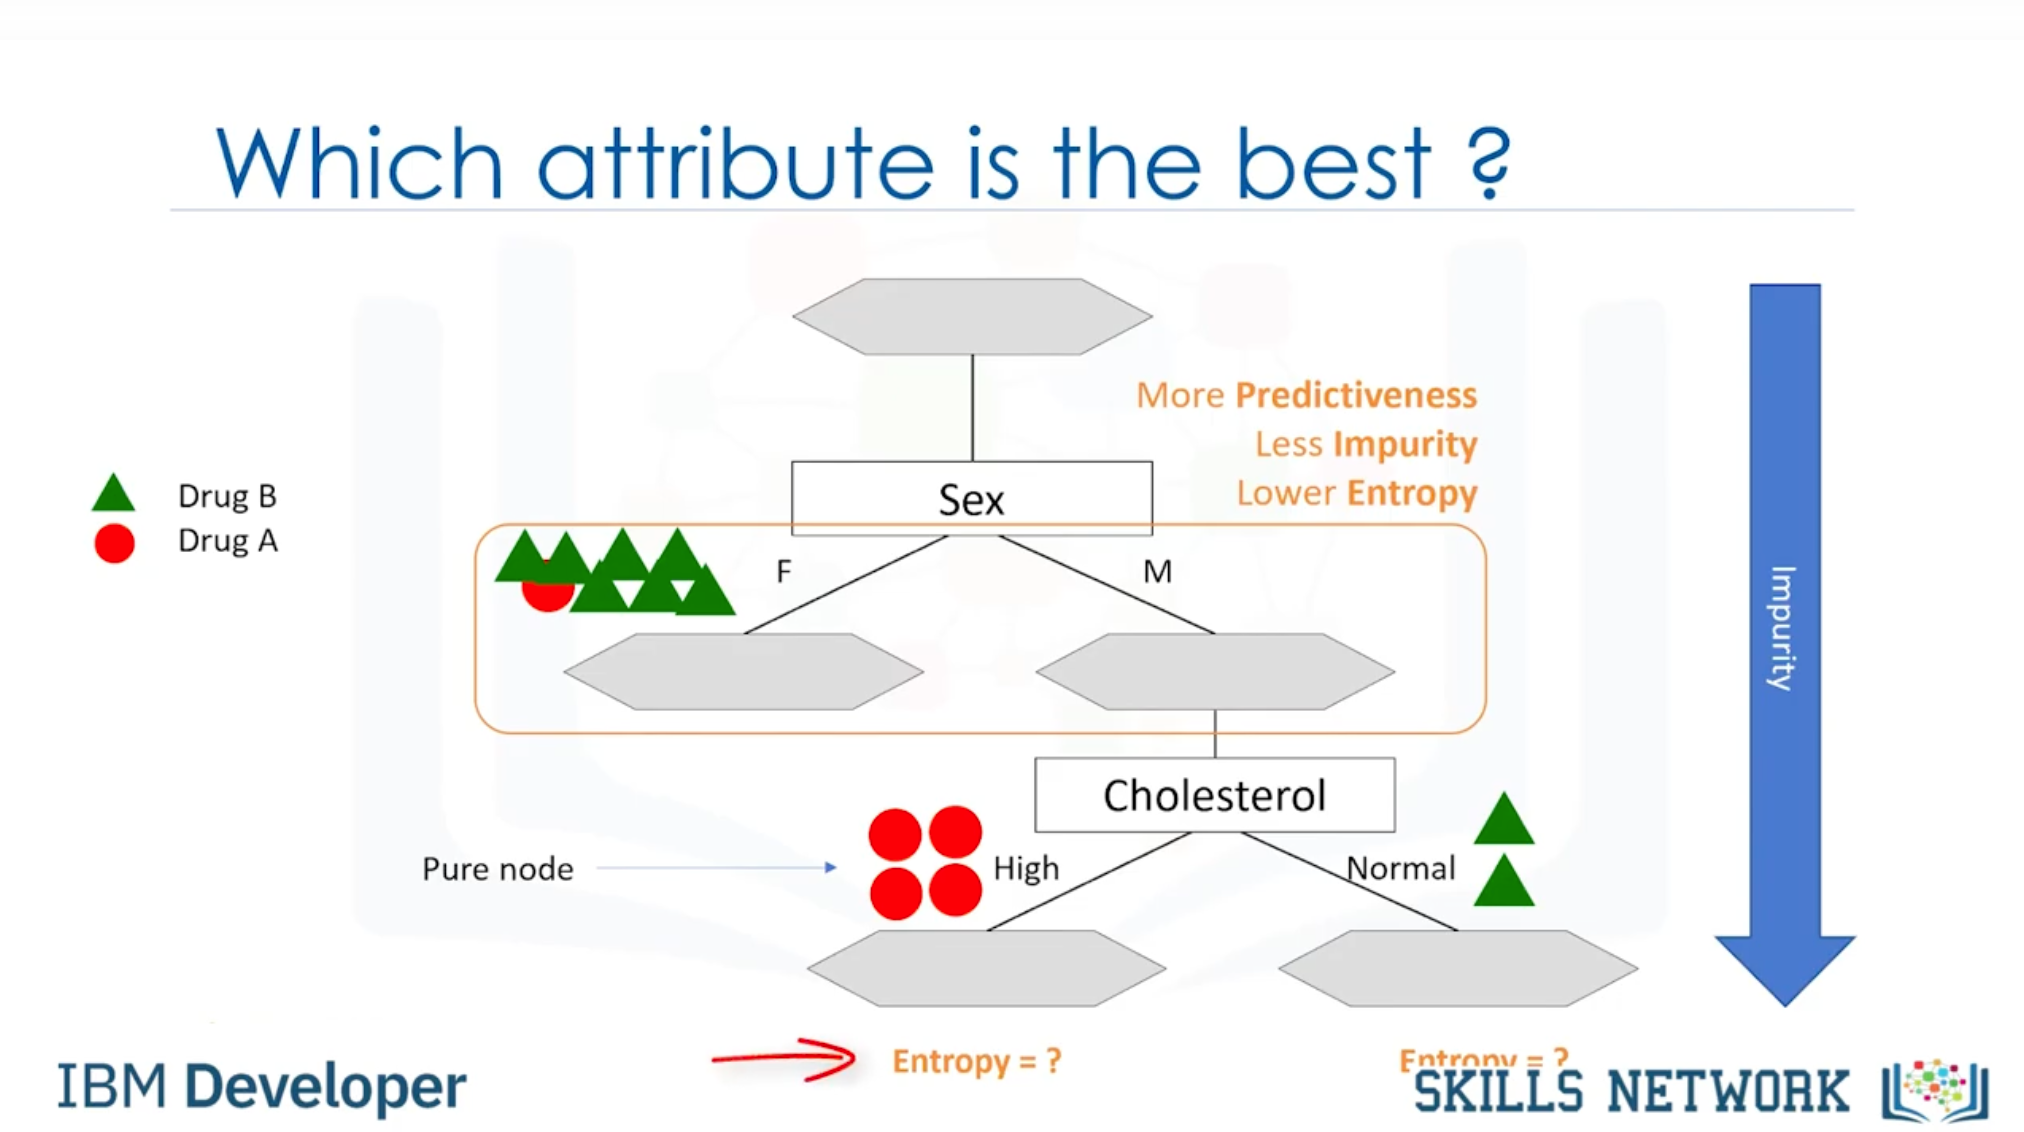
각각 attributute 에 의해 분류되는 과정마다 Impurity가 줄어든다. impurity는 entropy에 의해 결정된다. - What is entropy?
Measure of randomness or uncertainty. Node 안의 데이터가 binary 되어있을 때, 한쪽으로 확실히 분류되면 Entropy가 0이 된다.

- 어떤 Attribute 가 먼저 오면 좋을지는 어떻게 결정하나?
Information Gain after splitting 에 따라 결정
Information gain = (entropy before split) - (weighted entropy after split)
weighted entropy와 information gain은 반비례 관계인 것을 알 수 있다.
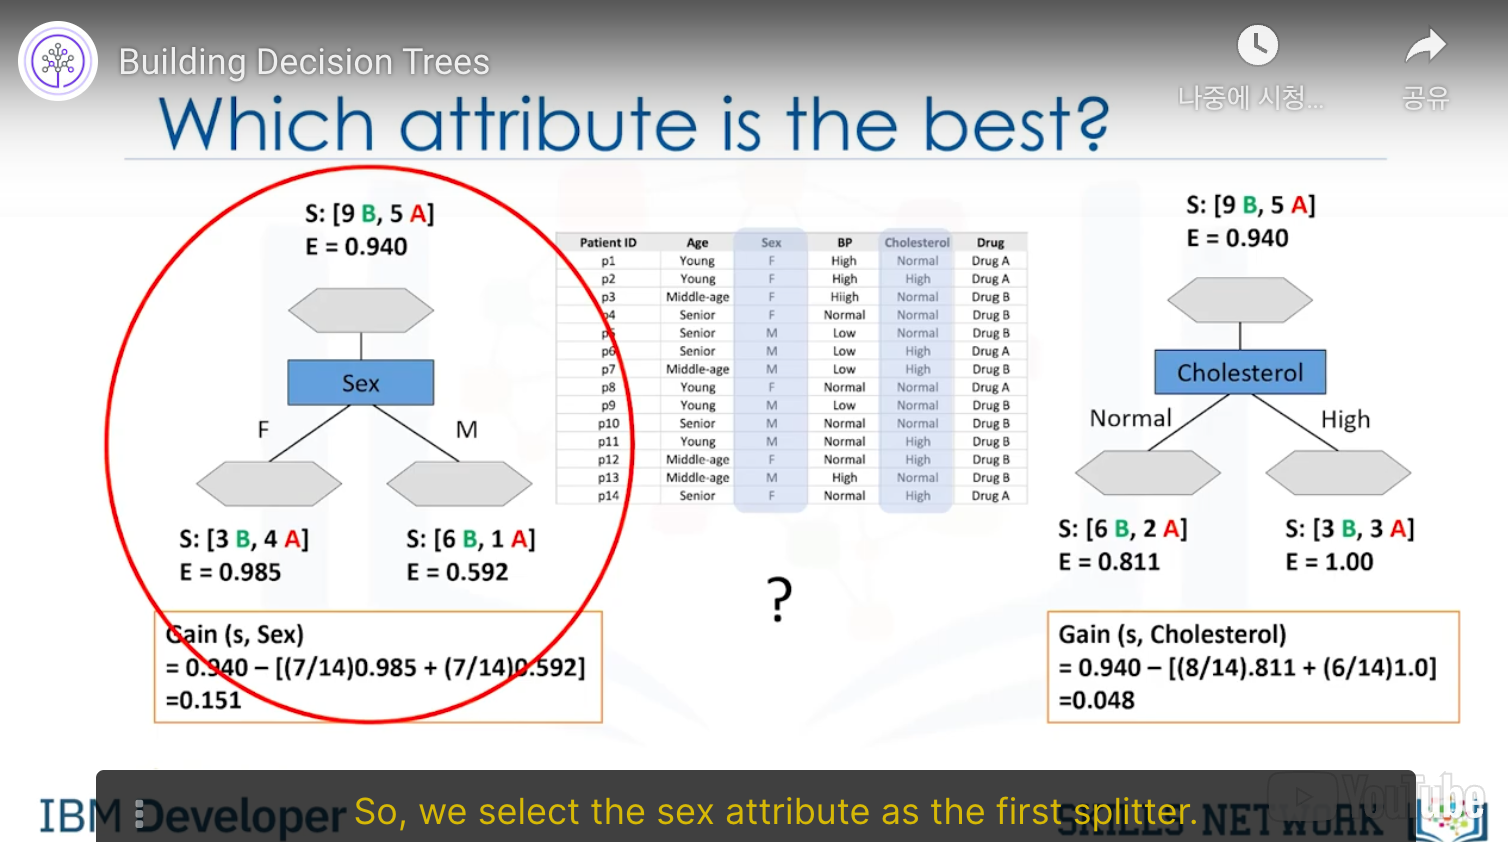
Better attribute 를 찾는 과정 - Logistic Regression은 무엇인가?
numeric continous value 를 prediction 값으로 갖는 linear regression과는 달리, binary된 prediction value를 갖는다. 하지만 multi class prediction value값을 갖는 경우도 있음
Independent variables는 continous value, dependent value는 categorical value 로 나타난다.

- Logistic regression은 언제 유용한가?
- if your data is binary. 0/1, yes/no, True/False
- if you need probabilistic results
- when you need a linear decision boundary
- if you need to understand the impact of a feature
- Linear regression vs Logistic regression
Normally, linear regression is used to predict continuous value, but we can also use it to predict binary value.
It has two Theta valuethe s
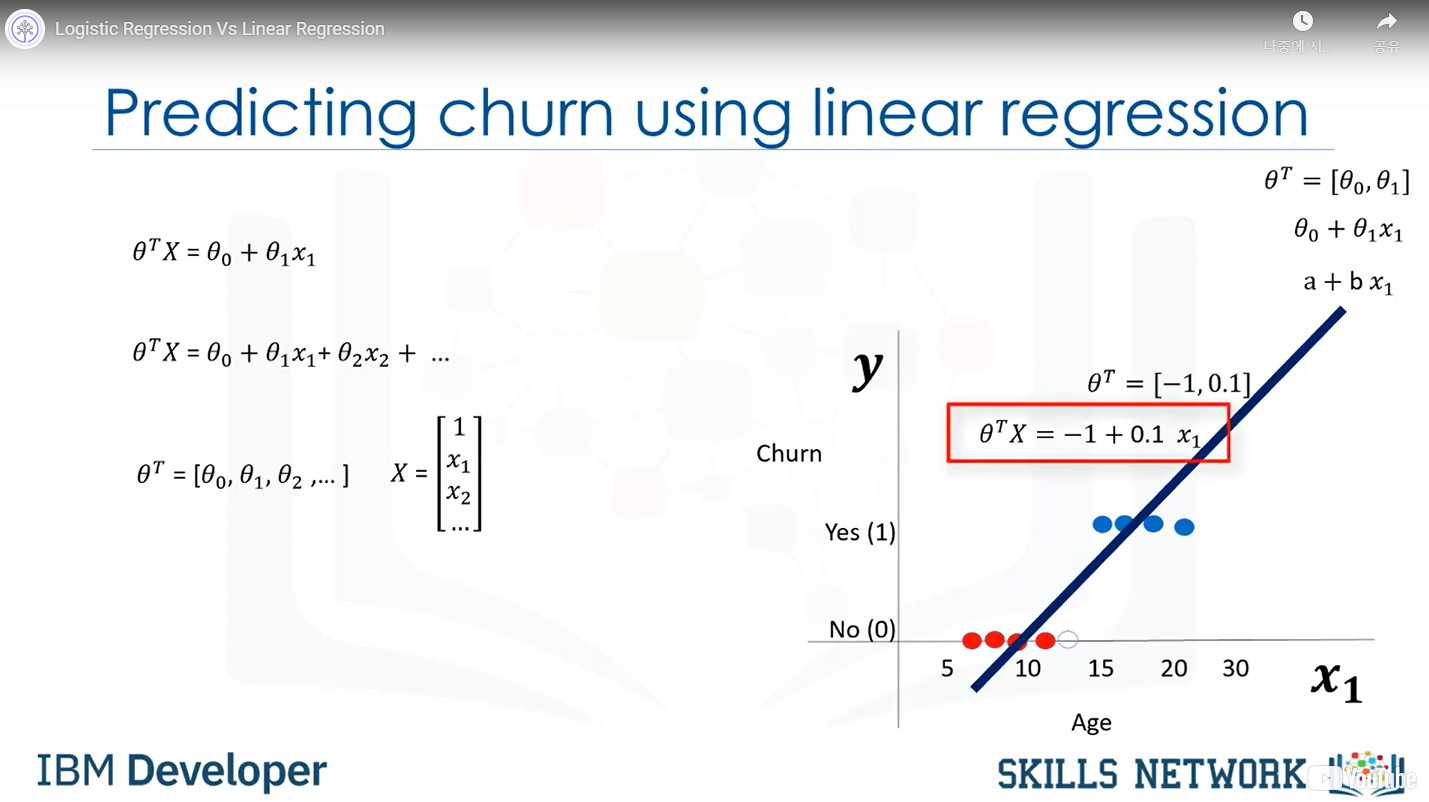
But y value is restricted between 0~1, so we need to define a threshold to categorize.

But here we have several problems. How can we find the probability that the customer belongs to 0?
So we use sigmoid function for the smoother line, and to find the probability.
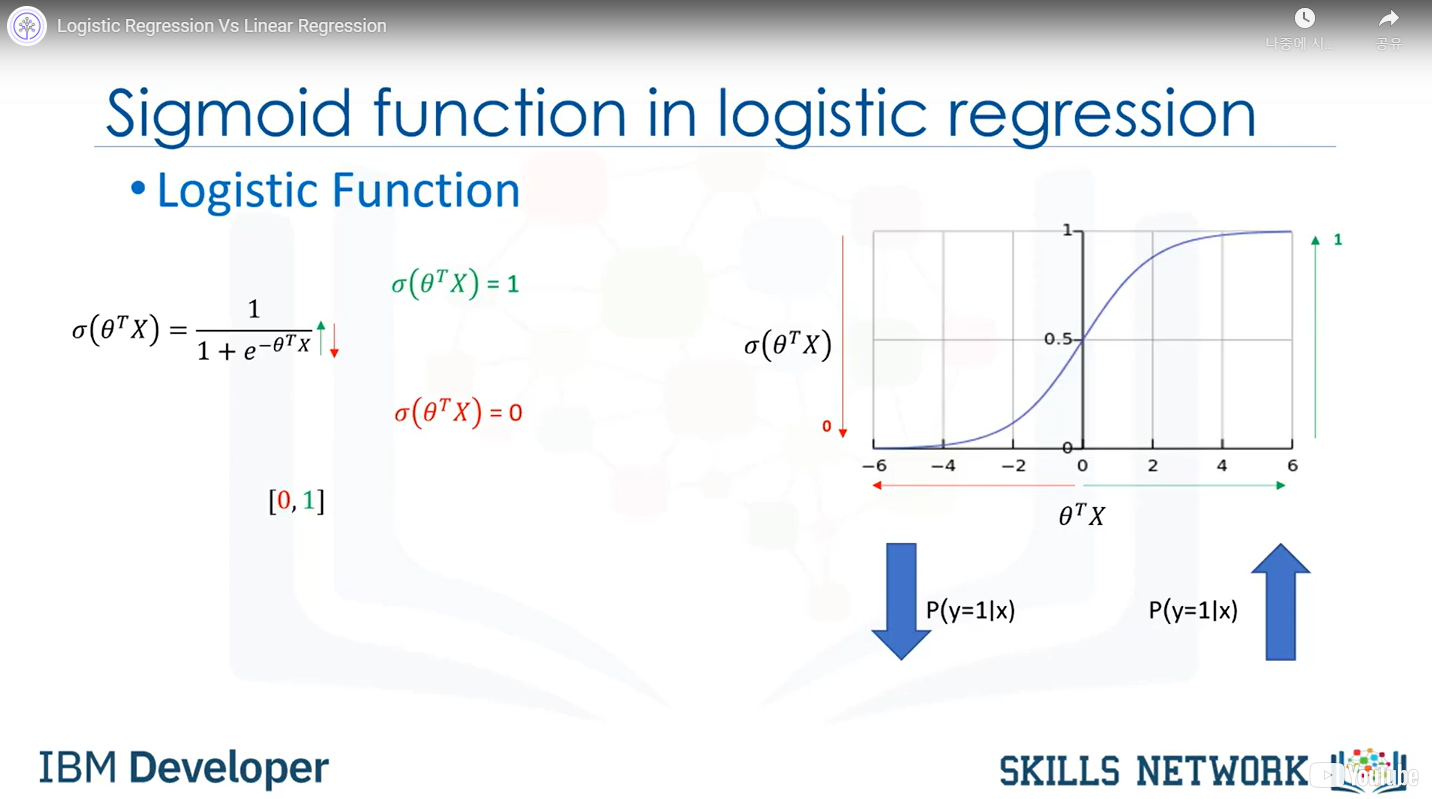
Sigmoid 함수의 공식. Theta transpose X가 커지면 1에 수렴, 작아지면 0에 수렴하게 된다. - How can we find Theta in sigmoid?
1. Initialize Theta
2. Calculate yhat for a customer
3. Compare the output of yhatthe with actual output of customer, y and record it as an error
4. Calculate the error for all customers
5. Change Theta to reduce the cost
6. Go back to step 2
- How can we change the values of Theta so that the cost is reduced across iterations? / When should we stop the iterations?
Gradient Decent
- How do we train the logistic model?
Cost function 을 쓰는 방법

Using the minus log, we can perform the cost function which cost reduces depending on yhat - Let's recap
- How do we find the best parameters for our model?
Minimize the cost function
- How do we minimize the cost function?
Using gradient Descent
- What is gradient descent?
A technique to use the derivative of a cost function to change the parameter values, in order to minimize the cost
- Training algorithm recap

- difference between Linear and Logistic Regression
Linear regression: continues values 를 yhat값으로 가짐
Logistic regression: binary values 를 yhat값으로 가짐.
# 내용 보충 필요
Classification with SVM
What is SVM?
- 지도학습의 일종으로, separator 를 찾아 케이스를 분류하는 알고리즘이다.
- 주로 Image recognition, Text category assignment, Detecting spam, Sentiment analysis, Gene expression classification, Regression, Outlier detection and clustering 등에 쓰임
- How does it work? Mapping data to a high-dimensional feature space
- Finding a separator
- Dimension can be variable

It's not linearly separated, which is the case of real-world data sets. - How do we transfer data in such a way that a separator could be drawn as a hyperplane?
-> transfer it into a two-dimensional space by using X square(X^2): kernelling
-> kernelling can be used in Linear, Polynomial, RBF, Sigmoid
- How can we find the best or optimized hyperplane separator after transformation?
-> 아래와 같이 margin을 최소화하는 방정식을 찾아 분류한다

- Advantages: 1. Accurate in high-dimensional spaces 2. Memory efficient
- Disadvantages: 1. Prone to over-fitting 2. No probability estimation 3. Small datasets(row가 1,000개를 넘어가는 빅데이터의 경우에는 쓰기가 어려움)
'Data Science' 카테고리의 다른 글
Computer Vision: 객체 트래킹 (0) 2022.11.13 Machine Learning with Python - Clustering (0) 2022.10.07 Machine Learning with Python - Regression(Simple, Multiple, Non-linear regression) (0) 2022.08.19 Machine Learning with Python - Intro (0) 2022.08.18 goodFeaturesToTrack method 이용해 코너 검출시 Can't parse 'center'. Sequence item with index 0 has a wrong type 에러 (0) 2022.08.14