Data Science
Data Analysis with Python - Model Development
Hiru_93
2022. 8. 13. 18:08
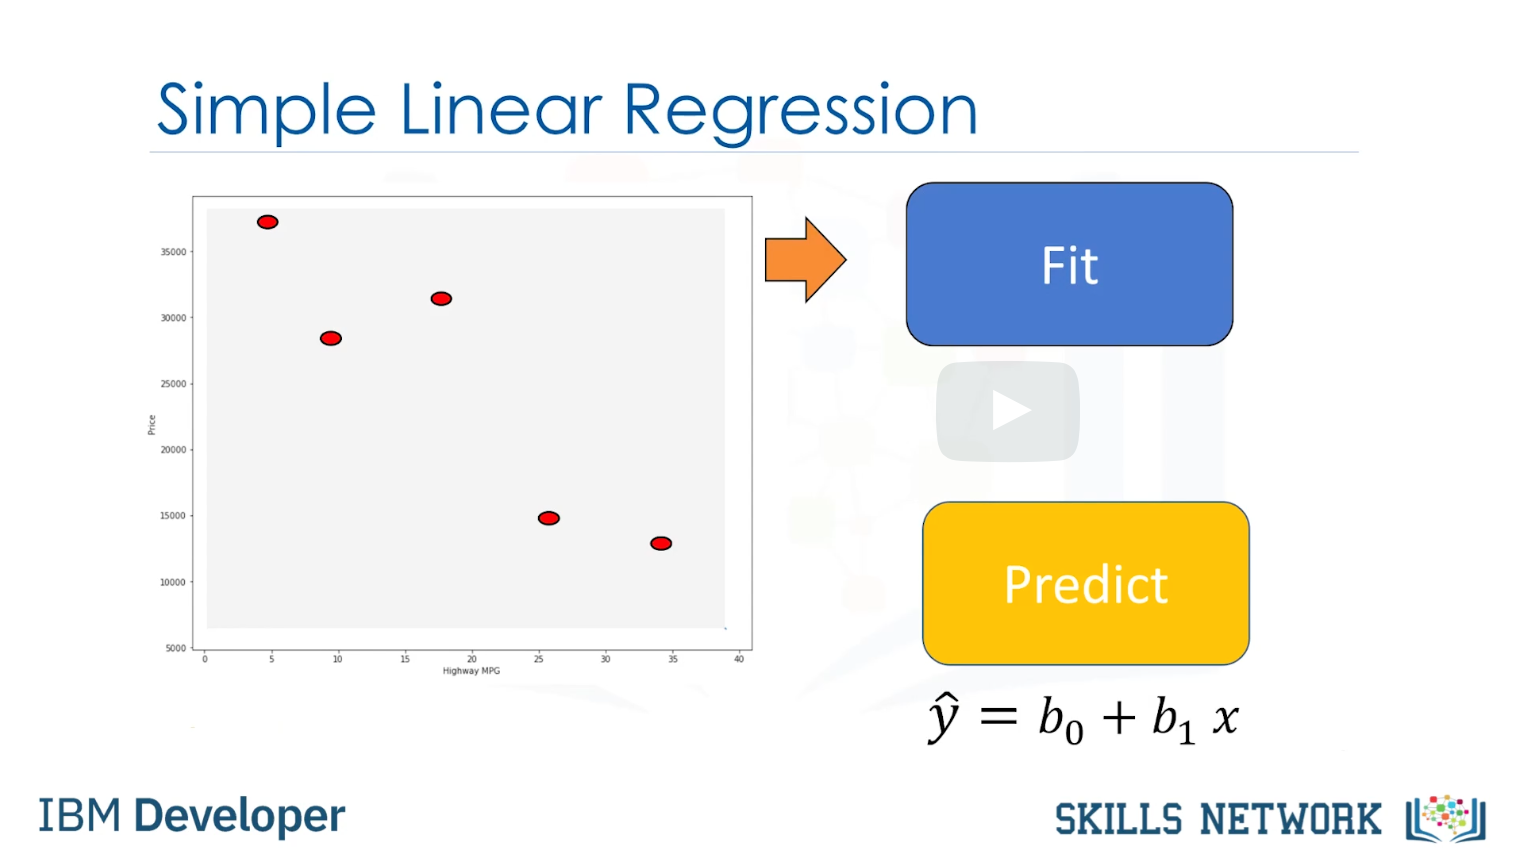
- A model can be thought of as a mathematical equation used to predict a value given one or more other values
- More relevant data → more accurate model
- 3 types of linear Regression
- Simple linear regression
- Multiple linear regression
- Polynomial regression
- Simple linear regression: The method to help us understand the relationship between two variables
- Multiple linear regression: The method to help us understand the relationship between multiple variables
과정: training points 를 모델에 집어넣음 -> predict값 도출
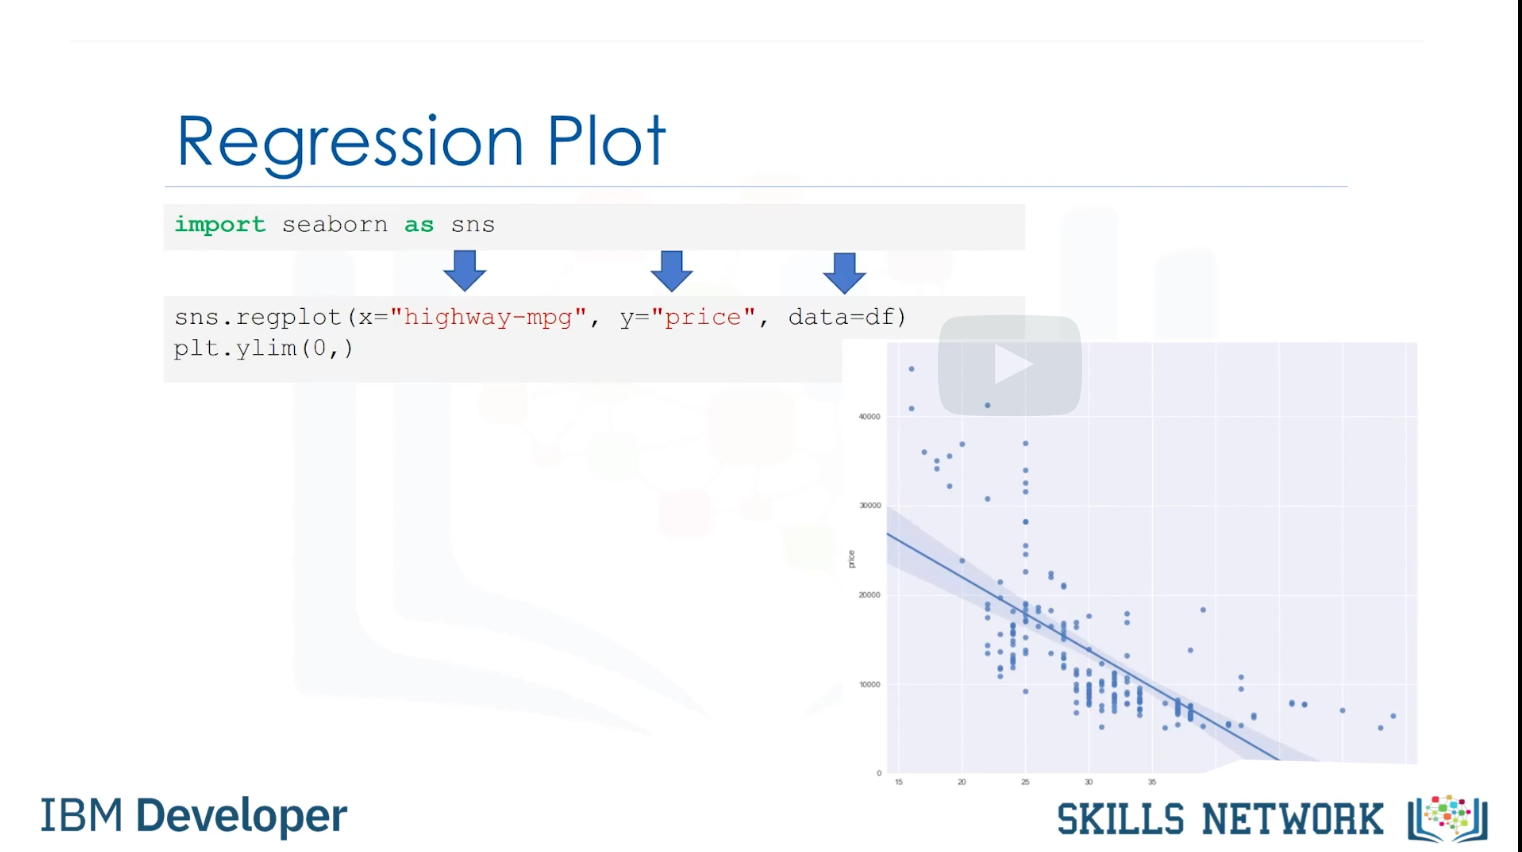
- Regression plot: strength of the correlation, direction of the relationship(positive/negative) 을 나타냄
- 수식은 다음과 같다:
import seabron as sns
sns.regplot(x = 'highway-mpg', y = 'price', data = df)
plt.ylim(0, )- 변수간의 상관성 구하는 코드:
df[['peak-rpm', 'highway-mpg', 'price']].corr()
- Distribution plots: simple plot보다 더 정확하게 모델을 구할 수 있음
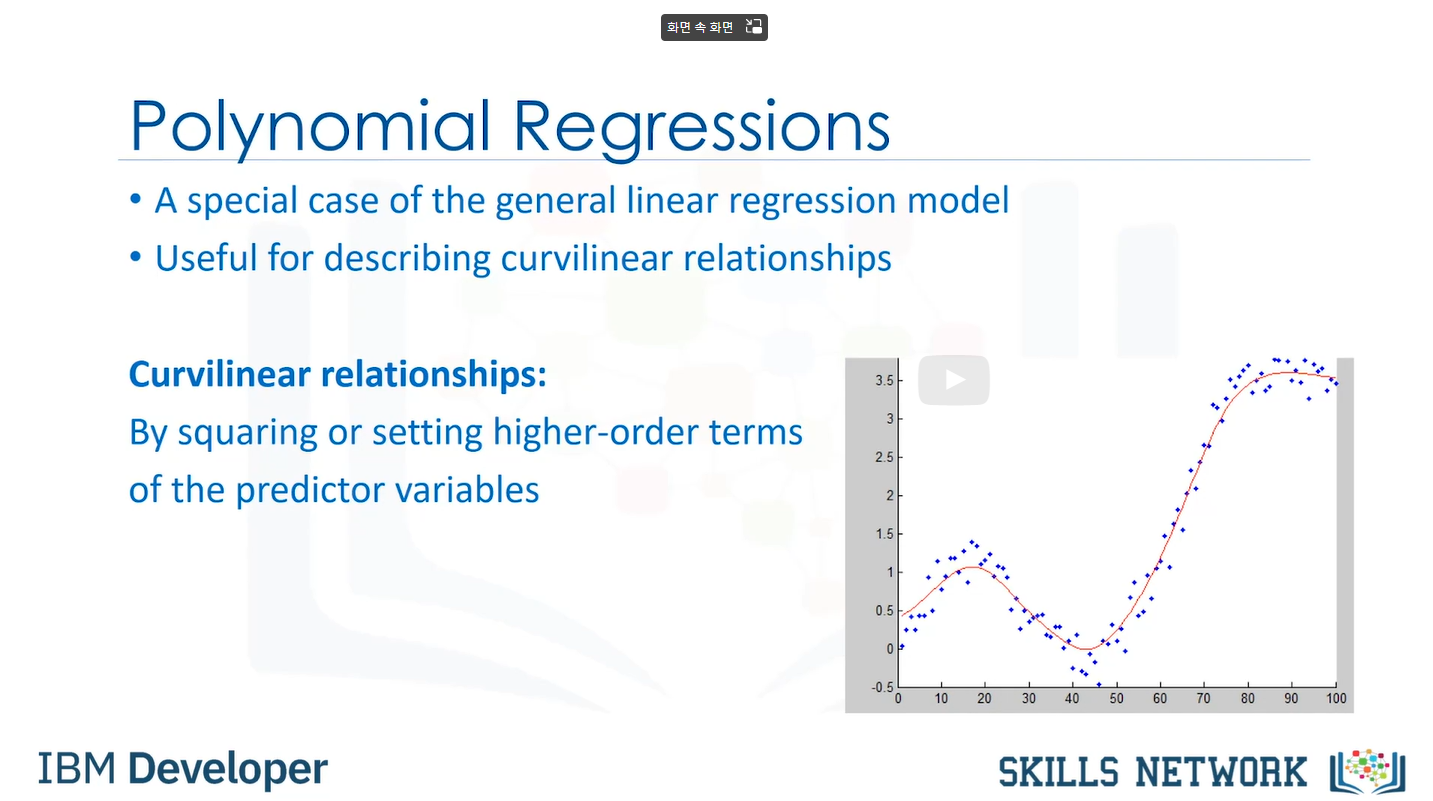
- Polynomial regression(다항 회귀): A special case of the general linear regression model
- Curvilinear relationship:
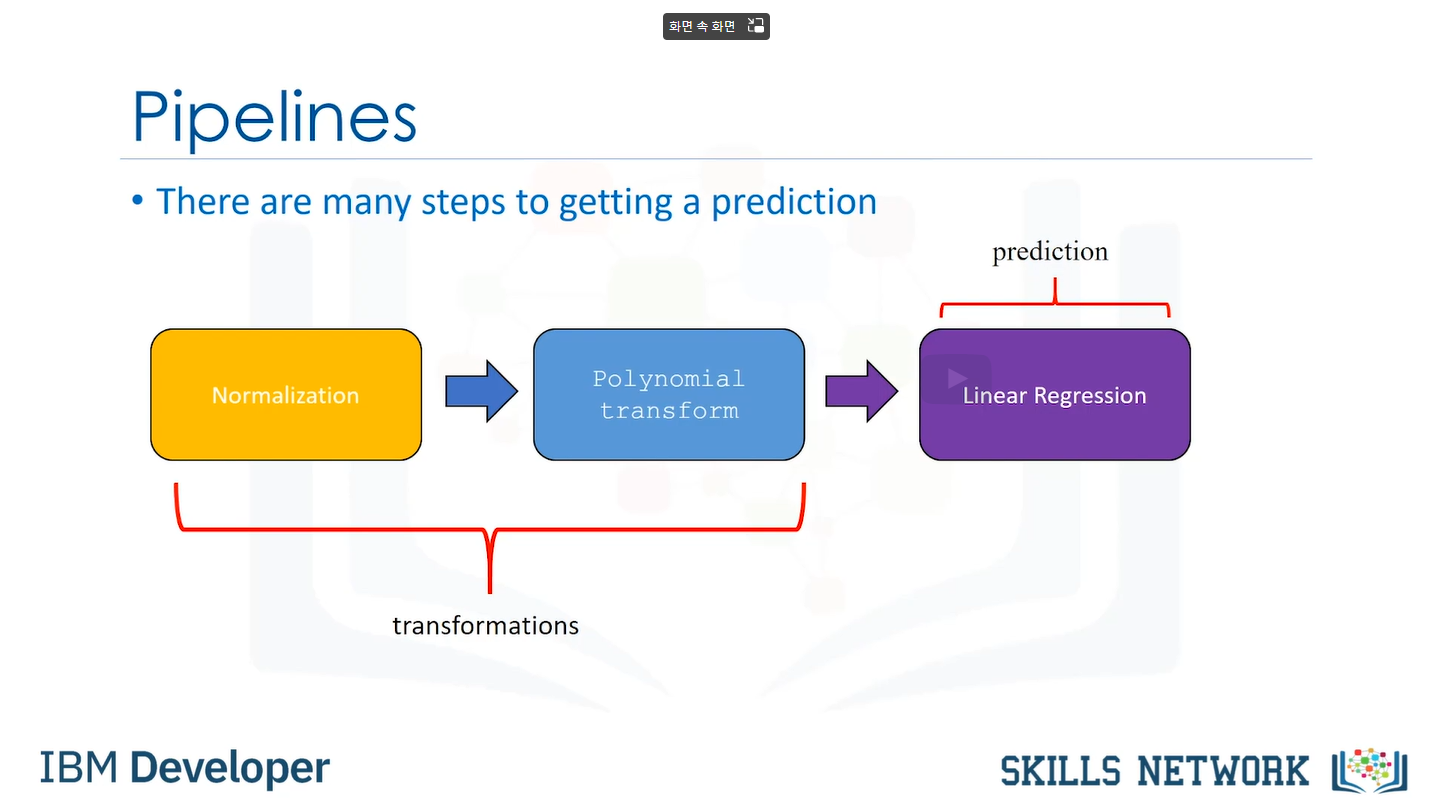
- Pipeline library 를 이용해 코드 단순화 가능
- Two important measures to determine the fit of a model:
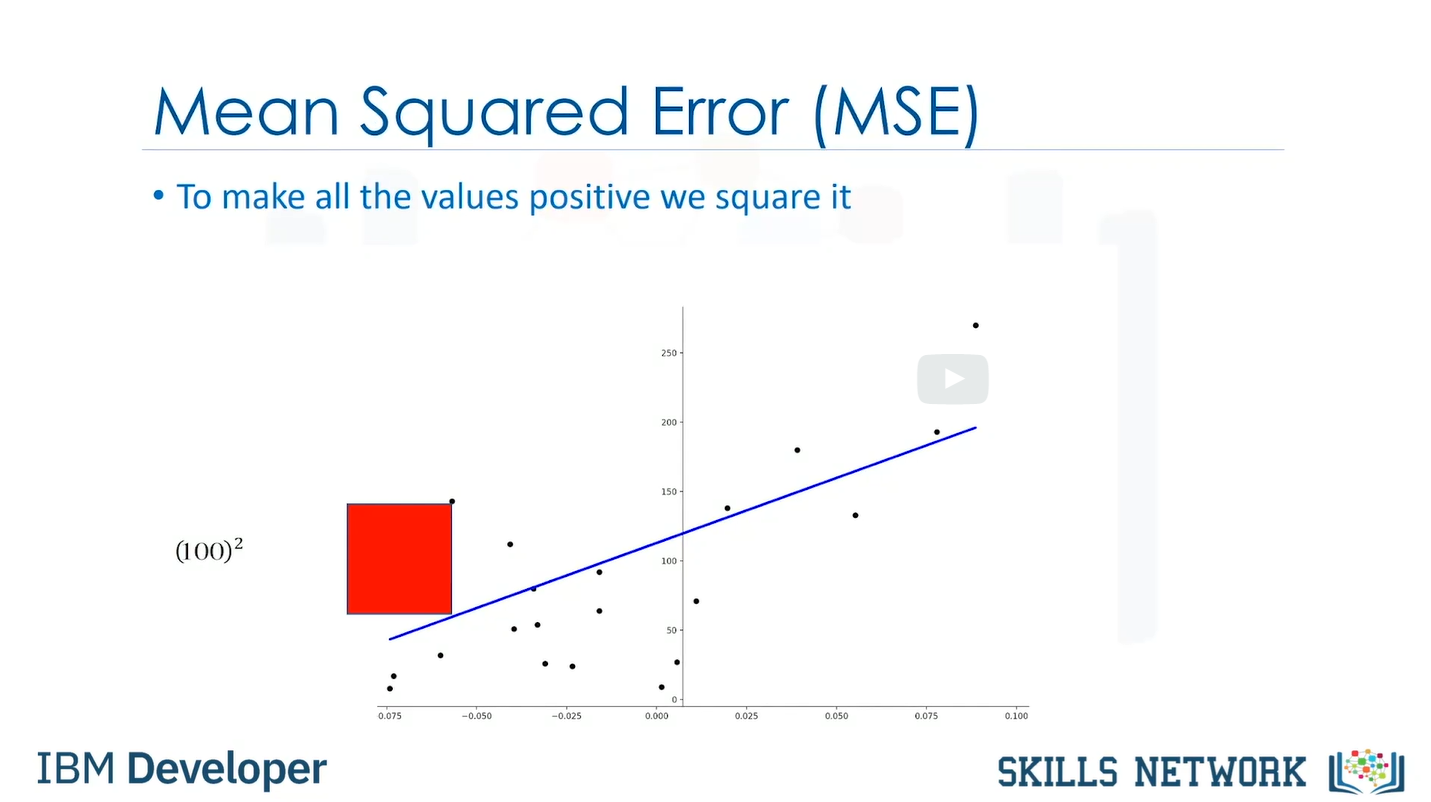
- Mean Squared Error(MSE)
아래 그림과 같이 선형회귀곡선과 value 값의 차이의 평균(아래 빨간색 박스의 평균)
파이썬 코드는 다음과 같다 ↓
from sklearn.metrics import mean_squared_error
mean_squared_error(df['price'], y_predict_simple_fit)
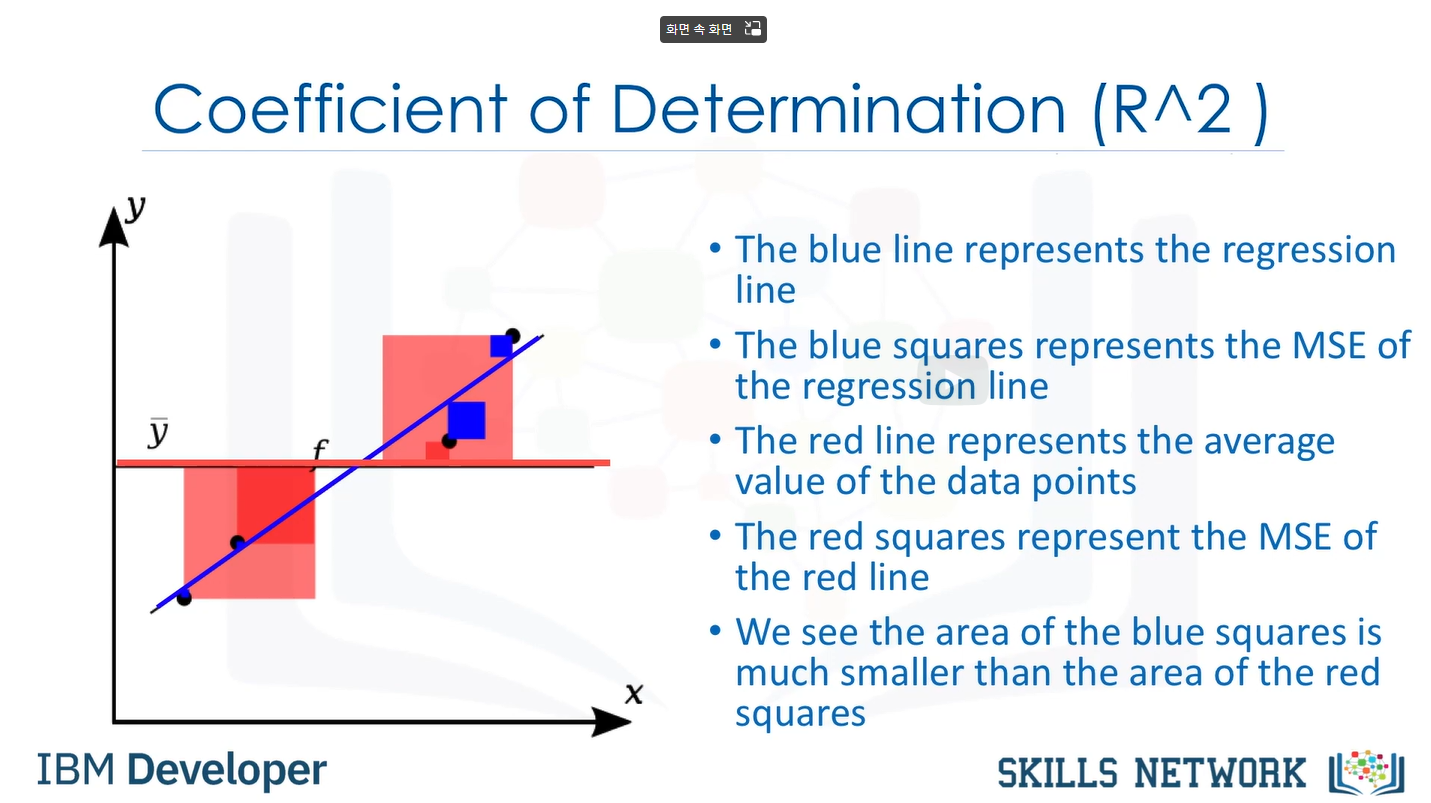
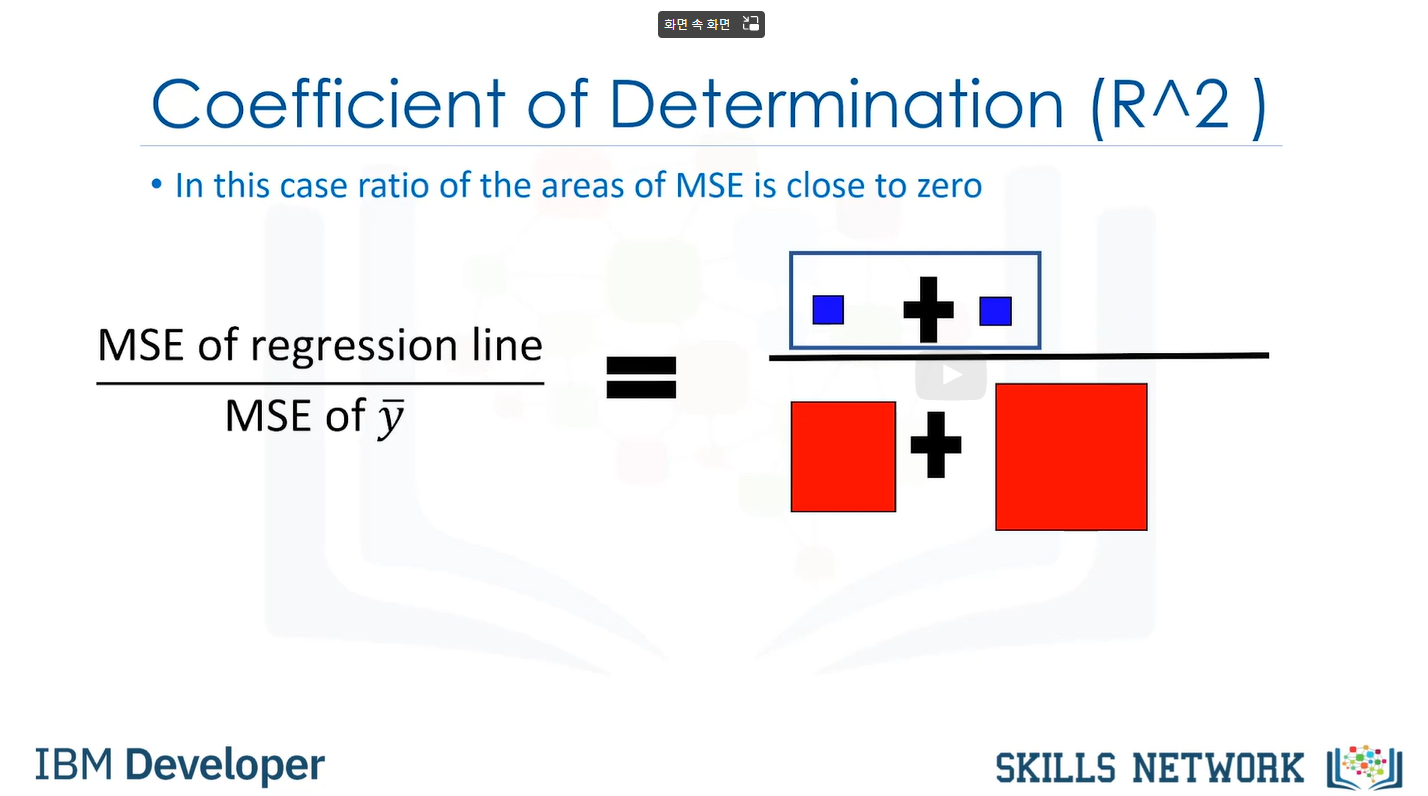
2. R-squared(R^2)
0-1의 값을 지지며, 식은 아래와 같다
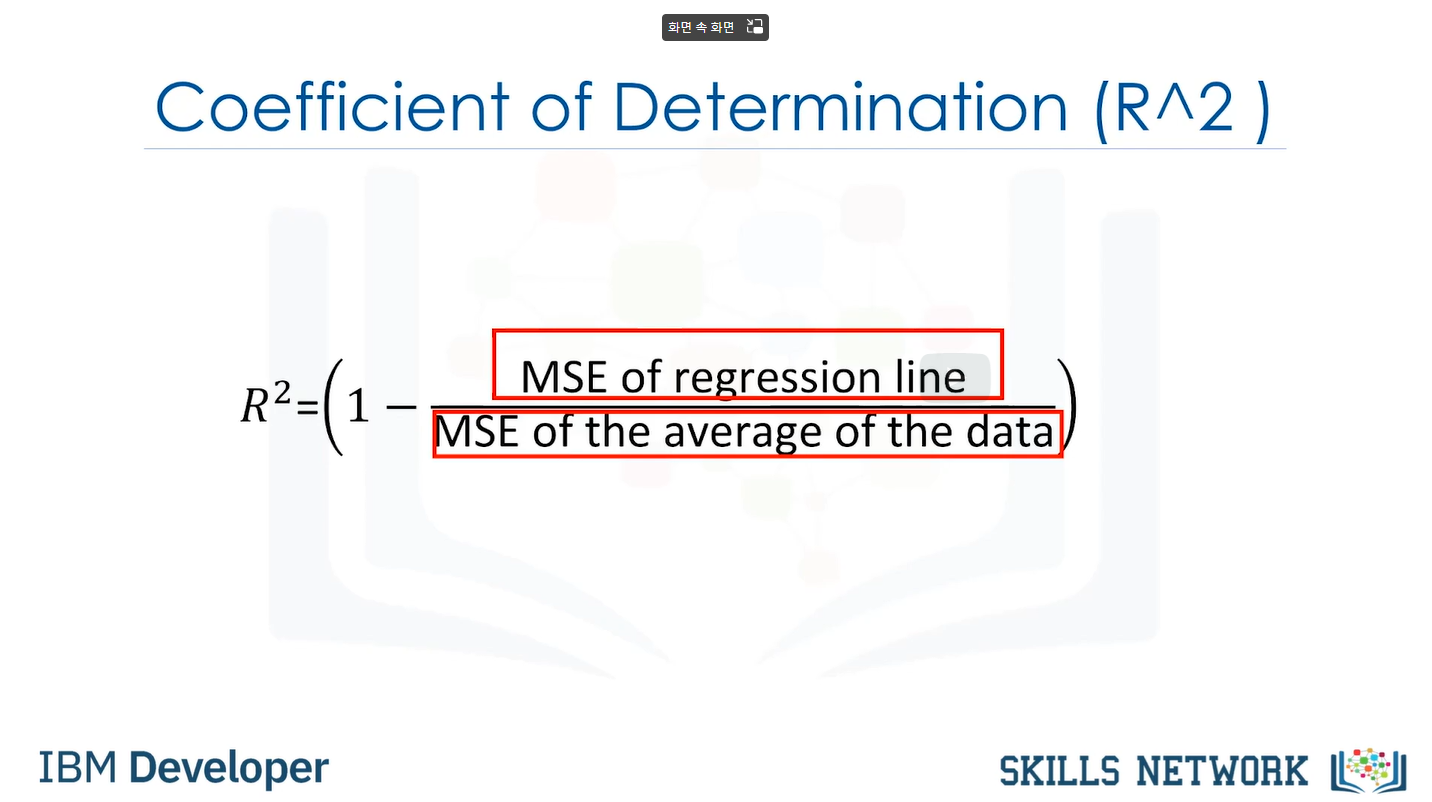
쉽게 표현하면 다음과 같다:
파이썬 수식으로 나타내면:
X = df[['highway-mpg']]
Y = df['price']
lm.fit(X, Y)
lm.score(x, y)
R^2값: 0.xxxx 만약 음의 값이 나올 경우, overfitting 을 의미함
- Predict the values that make sense
# First we train the model
lm.fit(df['highway-mpg'], df['rpices'])
# Let's predict the price of a car with 30 highway-mpg
lm.predict(np.array(30.0).reshape(-1,1))
# Result: $13771.30
Im.coef_result: -821.73337832 # highway-mpg
- How to generate sequence of values in specified range?
# Import numpy
import numpy as np
# We use numpy function arrange to generate a sequence from 1 to 100
new_input = np.arange(1,101,1).reshape(-1,1) # np.arrange(first point of the sequence, endpoint +1, step size)

- Lower Mean Square error doesn't imply better fit
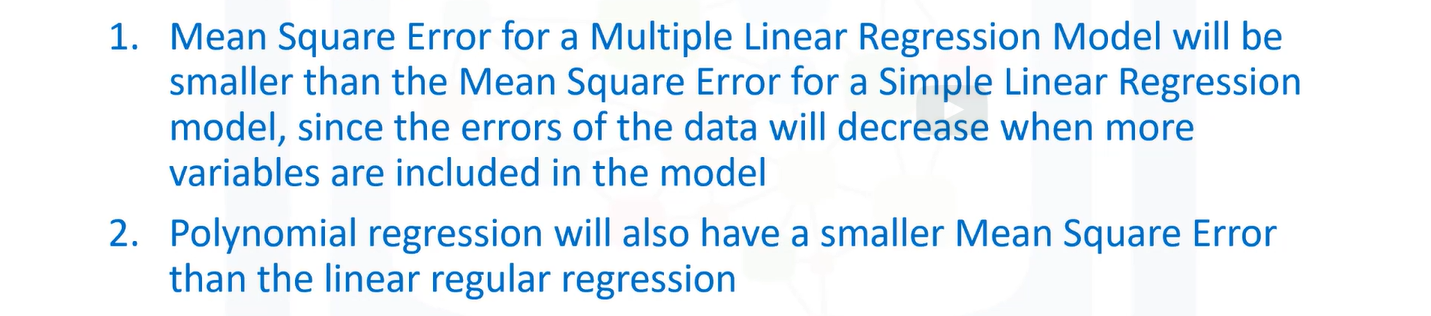
- When comparing models, higher R-squared value is a better fit for the data
- When comparing models, smallest MSE value is a better fit for the data