Data Science
Data Analysis with Python - Data Wrangling
Hiru_93
2022. 8. 13. 17:28
- Data Wrangling 이란 raw data를 보다 쉽게 분석할 수 있다고 정리하고 통합하는 과정이다
- 칼럼 추가하는 법
file_name = "파일.csv"
df = pd.read.csv(file_name)
df['column'] = df['column']+1- Missing data는 어떻게 처리하나?
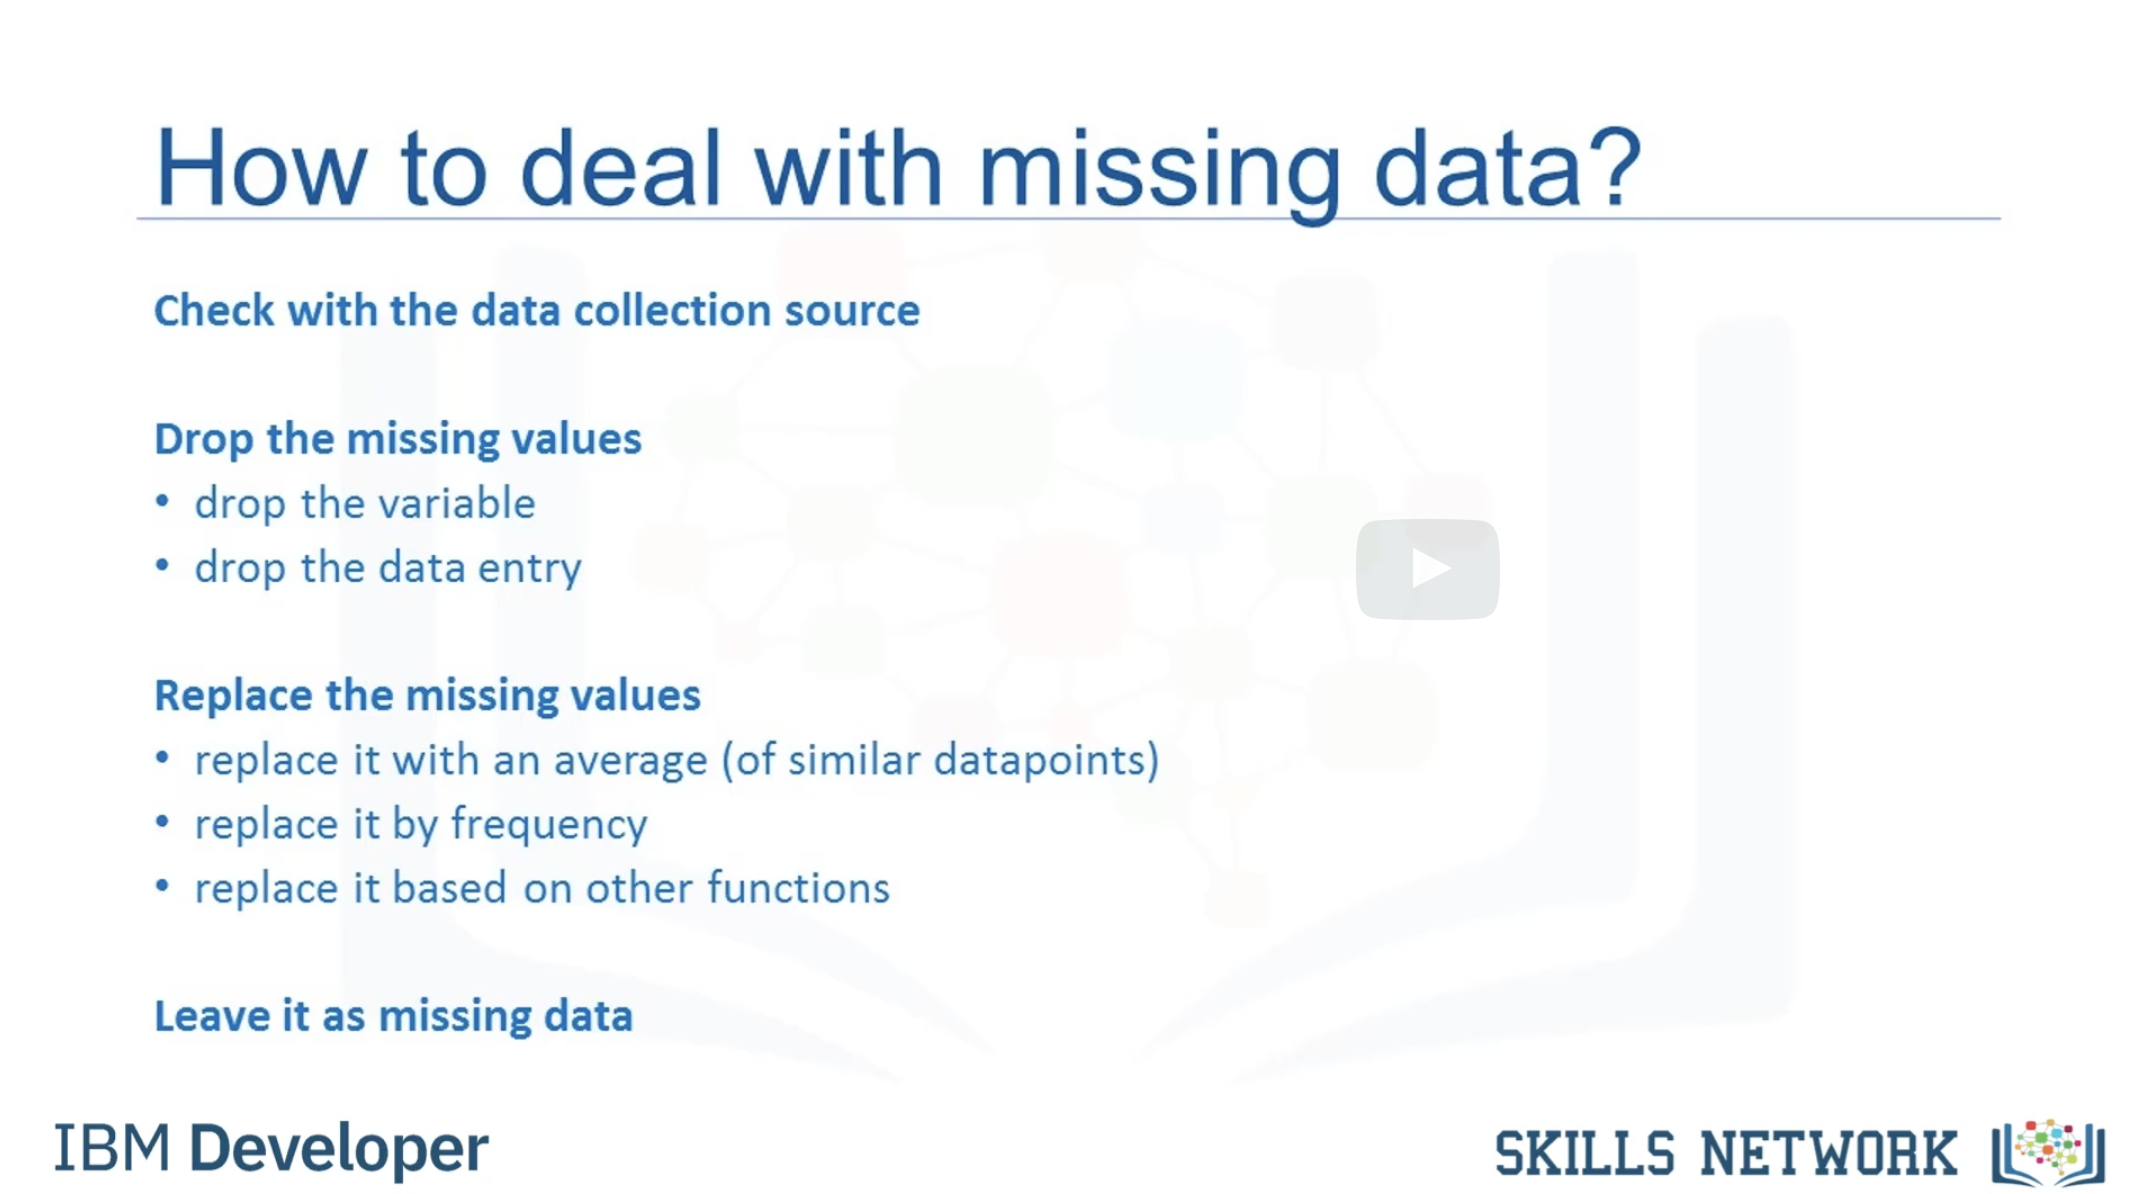
- How to drop missing values?
df.dropna() # df is the dataframe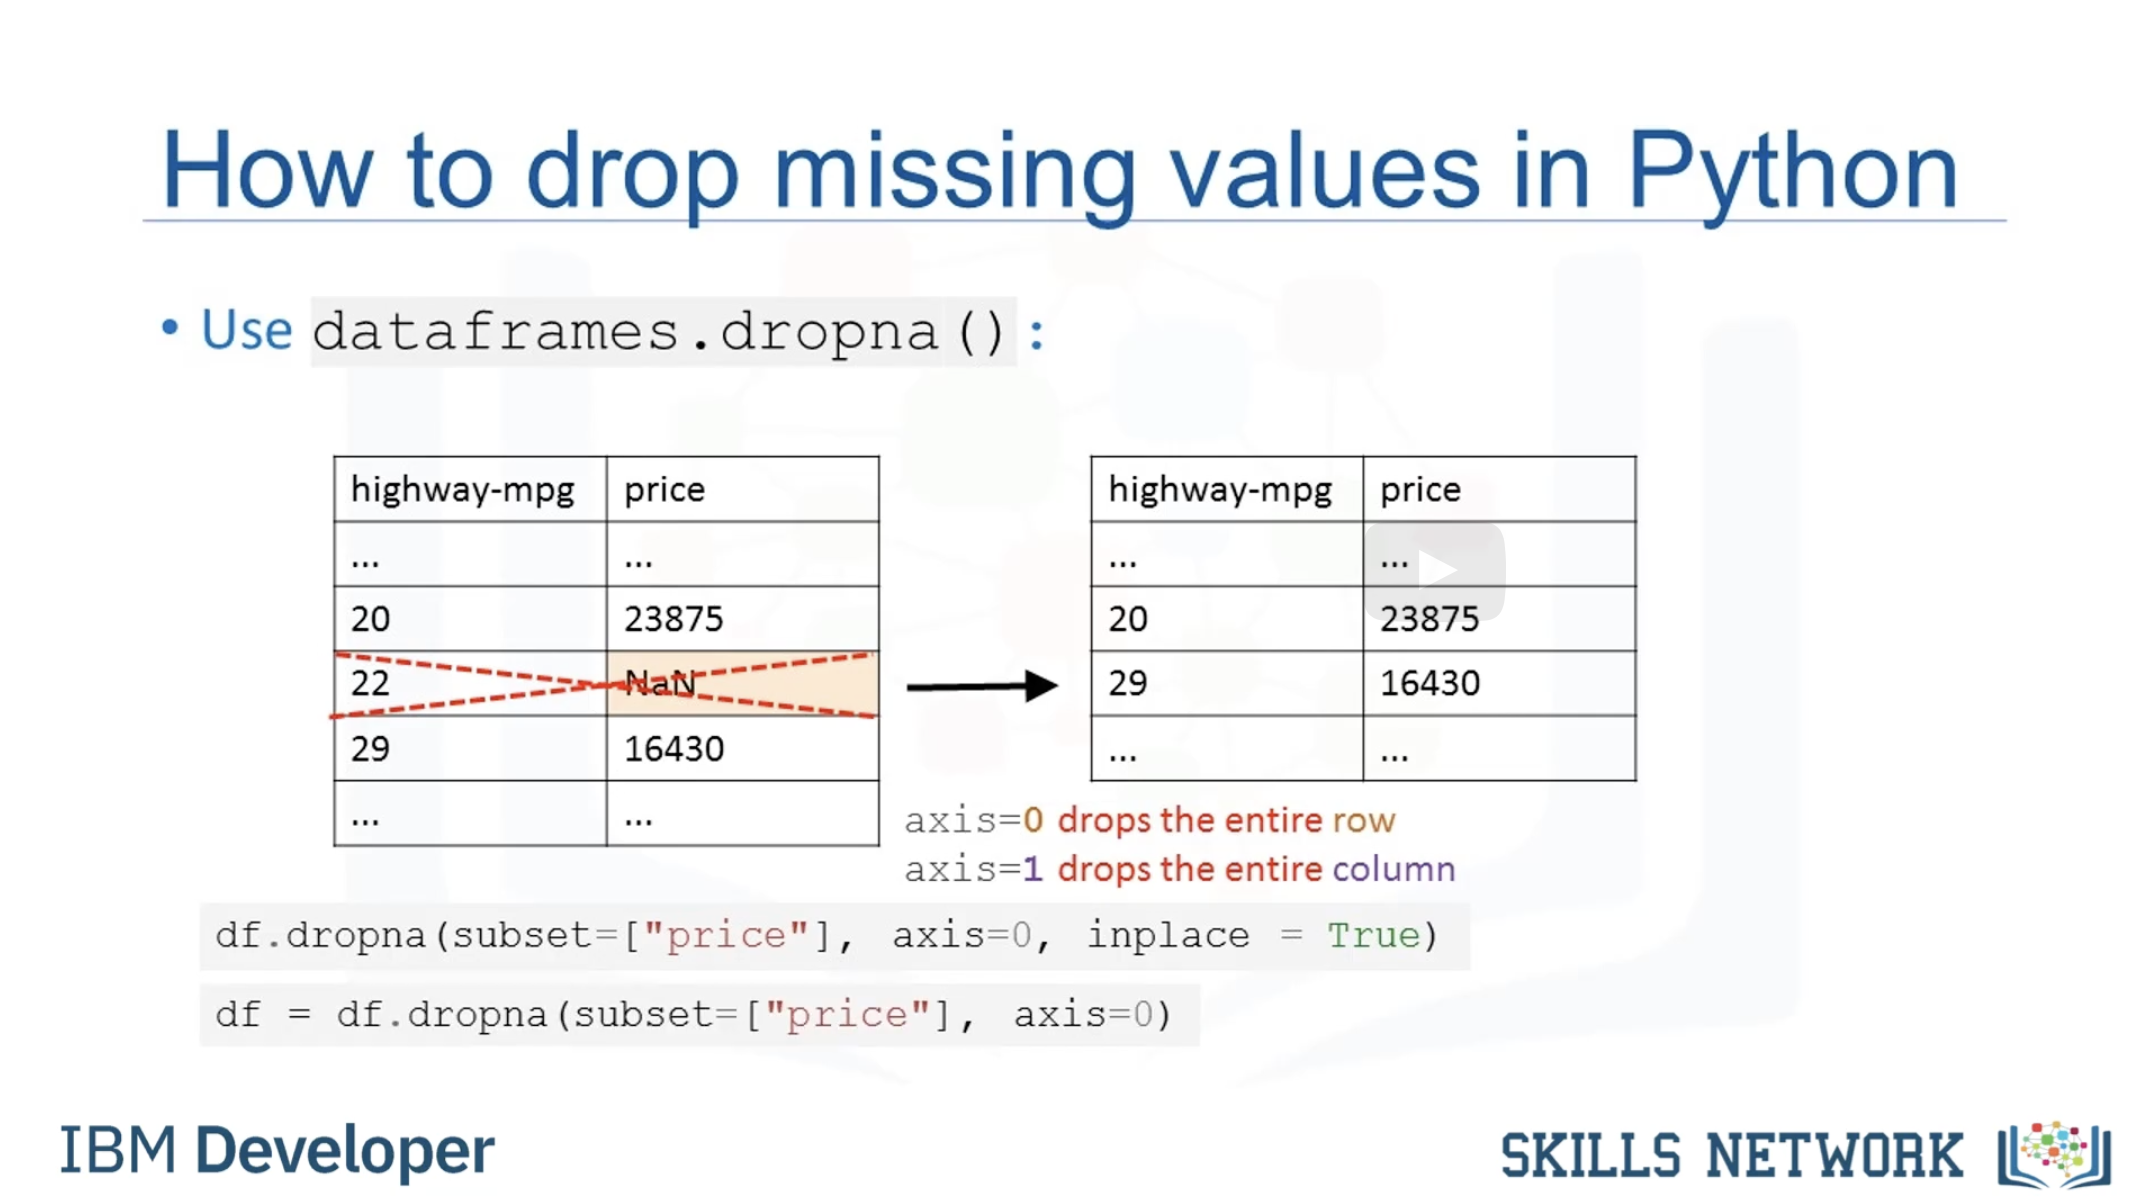
df.dropna(subset = ['price'], axis = 0, inplace = True) # 와
df = df.dropna(subset=['price'], axis=0) # 은 같다- Make sure that inplace = True
- How to replace missing values?
df.replace(missing_value, new_value)보통은 평균값으로 값을 replace 한다
mean = df['column'].mean()
df['column'].replace(np.nan, mean)
- Dataframe.astype can be used to convert a data type from one format to another. For instance int → float. Int and Float types are mostly used to convert the format to another.
- When convert the dataset form "city_mpg" → "city-L/100km",
#명령어는 다음과 같다
df.rename(columns = {"city_mpg": "city-L/100km"}, inplace = True)- Data normalization: 크게 Simple Feature scaling, Min-Max, Z-Score 이 있음
- Scaling method
df["length"] = df["length"] / df["length"].max() # 와 같이 max 를 이용해 구할수 있음- Min-Max method
(df["length"] - df["length"].min()) / (df["length"].max() - df["length"].min()- Z-score method
df["length"] = (df["length"] - df["length"].mean()) / df["length"].std() # 에서 mean은 데이터셋 평균을 구하고, std는 표준편차를 구함- Binning: 변수 Group을 "bins"로 치환하는 것. 숫자에서 categorized 된 변수로 바꾸는 것을 말한다
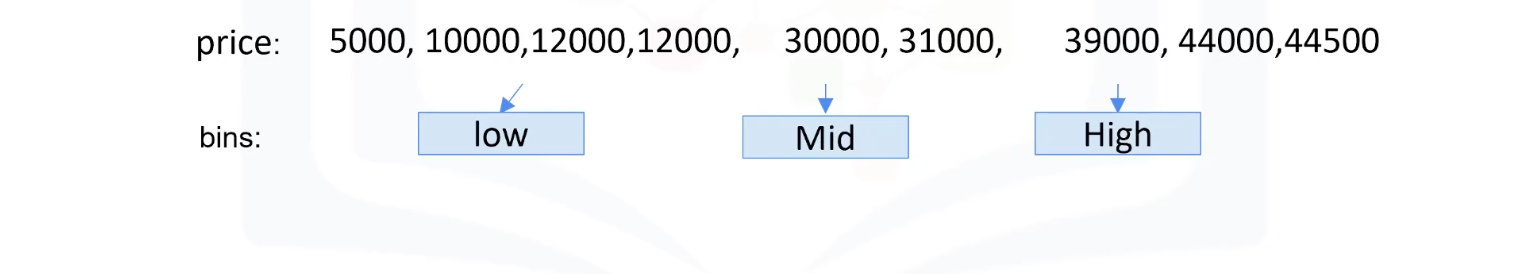
Bins = np.linspace(min(df["price"]), max(df["price"]), 4)
Group_names = ["Low", "Medium", "High"]- To segment and sort the data values into bins:
df["price-binned"] = pd.cut(df["price"], bins, labels = group_names, include_lowest = True)- 그렇다면 categorized 된 변수를 quantitative 변수로 바꾸는 방법은?
- Solution: Dummy 변수 카테고리에 추가한다. 0 or 1 in each catgory

- 판다스 라이브러리 명령어
pd.get_dummies(df['fuel'])